Samoan vs Immigrants from Germany Median Earnings
COMPARE
Samoan
Immigrants from Germany
Median Earnings
Median Earnings Comparison
Samoans
Immigrants from Germany
$44,206
MEDIAN EARNINGS
4.2/ 100
METRIC RATING
241st/ 347
METRIC RANK
$47,566
MEDIAN EARNINGS
83.1/ 100
METRIC RATING
152nd/ 347
METRIC RANK
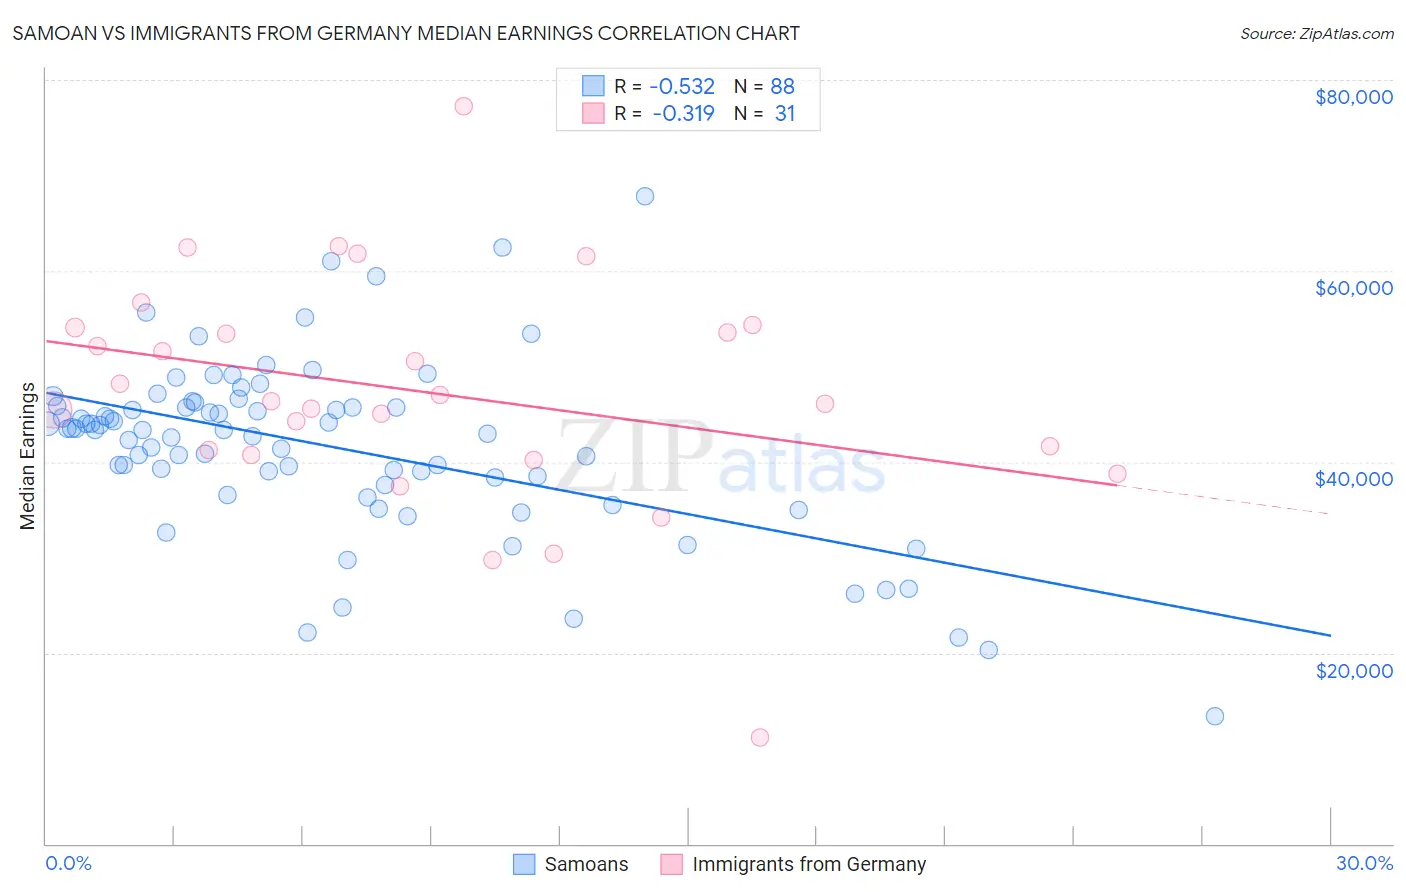
Samoan vs Immigrants from Germany Median Earnings Correlation Chart
The statistical analysis conducted on geographies consisting of 225,197,093 people shows a substantial negative correlation between the proportion of Samoans and median earnings in the United States with a correlation coefficient (R) of -0.532 and weighted average of $44,206. Similarly, the statistical analysis conducted on geographies consisting of 463,817,606 people shows a mild negative correlation between the proportion of Immigrants from Germany and median earnings in the United States with a correlation coefficient (R) of -0.319 and weighted average of $47,566, a difference of 7.6%.
Median Earnings Correlation Summary
| Measurement | Samoan | Immigrants from Germany |
| Minimum | $13,413 | $11,184 |
| Maximum | $67,875 | $77,202 |
| Range | $54,462 | $66,018 |
| Mean | $41,589 | $47,273 |
| Median | $43,332 | $46,327 |
| Interquartile 25% (IQ1) | $37,950 | $40,729 |
| Interquartile 75% (IQ3) | $45,824 | $54,030 |
| Interquartile Range (IQR) | $7,874 | $13,301 |
| Standard Deviation (Sample) | $9,289 | $12,257 |
| Standard Deviation (Population) | $9,236 | $12,057 |
Similar Demographics by Median Earnings
Demographics Similar to Samoans by Median Earnings
In terms of median earnings, the demographic groups most similar to Samoans are Aleut ($44,241, a difference of 0.080%), Immigrants from Venezuela ($44,163, a difference of 0.10%), Subsaharan African ($44,118, a difference of 0.20%), Nonimmigrants ($44,117, a difference of 0.20%), and Senegalese ($44,373, a difference of 0.38%).
| Demographics | Rating | Rank | Median Earnings |
| Cape Verdeans | 7.5 /100 | #234 | Tragic $44,640 |
| Venezuelans | 6.9 /100 | #235 | Tragic $44,580 |
| British West Indians | 6.7 /100 | #236 | Tragic $44,552 |
| Immigrants | Ecuador | 5.9 /100 | #237 | Tragic $44,462 |
| Sudanese | 5.6 /100 | #238 | Tragic $44,419 |
| Senegalese | 5.3 /100 | #239 | Tragic $44,373 |
| Aleuts | 4.4 /100 | #240 | Tragic $44,241 |
| Samoans | 4.2 /100 | #241 | Tragic $44,206 |
| Immigrants | Venezuela | 4.0 /100 | #242 | Tragic $44,163 |
| Sub-Saharan Africans | 3.7 /100 | #243 | Tragic $44,118 |
| Immigrants | Nonimmigrants | 3.7 /100 | #244 | Tragic $44,117 |
| Immigrants | Burma/Myanmar | 3.2 /100 | #245 | Tragic $43,998 |
| Immigrants | West Indies | 3.1 /100 | #246 | Tragic $43,989 |
| Immigrants | Cabo Verde | 3.0 /100 | #247 | Tragic $43,963 |
| Nepalese | 2.6 /100 | #248 | Tragic $43,860 |
Demographics Similar to Immigrants from Germany by Median Earnings
In terms of median earnings, the demographic groups most similar to Immigrants from Germany are Immigrants from Oceania ($47,617, a difference of 0.11%), Peruvian ($47,628, a difference of 0.13%), Luxembourger ($47,640, a difference of 0.16%), Immigrants from Eritrea ($47,657, a difference of 0.19%), and Slavic ($47,470, a difference of 0.20%).
| Demographics | Rating | Rank | Median Earnings |
| Immigrants | Saudi Arabia | 85.6 /100 | #145 | Excellent $47,704 |
| Immigrants | Chile | 85.5 /100 | #146 | Excellent $47,697 |
| Immigrants | South Eastern Asia | 85.0 /100 | #147 | Excellent $47,671 |
| Immigrants | Eritrea | 84.8 /100 | #148 | Excellent $47,657 |
| Luxembourgers | 84.5 /100 | #149 | Excellent $47,640 |
| Peruvians | 84.2 /100 | #150 | Excellent $47,628 |
| Immigrants | Oceania | 84.1 /100 | #151 | Excellent $47,617 |
| Immigrants | Germany | 83.1 /100 | #152 | Excellent $47,566 |
| Slavs | 81.1 /100 | #153 | Excellent $47,470 |
| Immigrants | Portugal | 77.3 /100 | #154 | Good $47,304 |
| Immigrants | Vietnam | 76.7 /100 | #155 | Good $47,282 |
| Irish | 76.6 /100 | #156 | Good $47,276 |
| Czechs | 75.1 /100 | #157 | Good $47,221 |
| Slovaks | 71.7 /100 | #158 | Good $47,095 |
| Immigrants | Peru | 69.6 /100 | #159 | Good $47,025 |