Samoan vs Comanche Divorced or Separated
COMPARE
Samoan
Comanche
Divorced or Separated
Divorced or Separated Comparison
Samoans
Comanche
12.0%
DIVORCED OR SEPARATED
64.3/ 100
METRIC RATING
162nd/ 347
METRIC RANK
13.5%
DIVORCED OR SEPARATED
0.0/ 100
METRIC RATING
327th/ 347
METRIC RANK
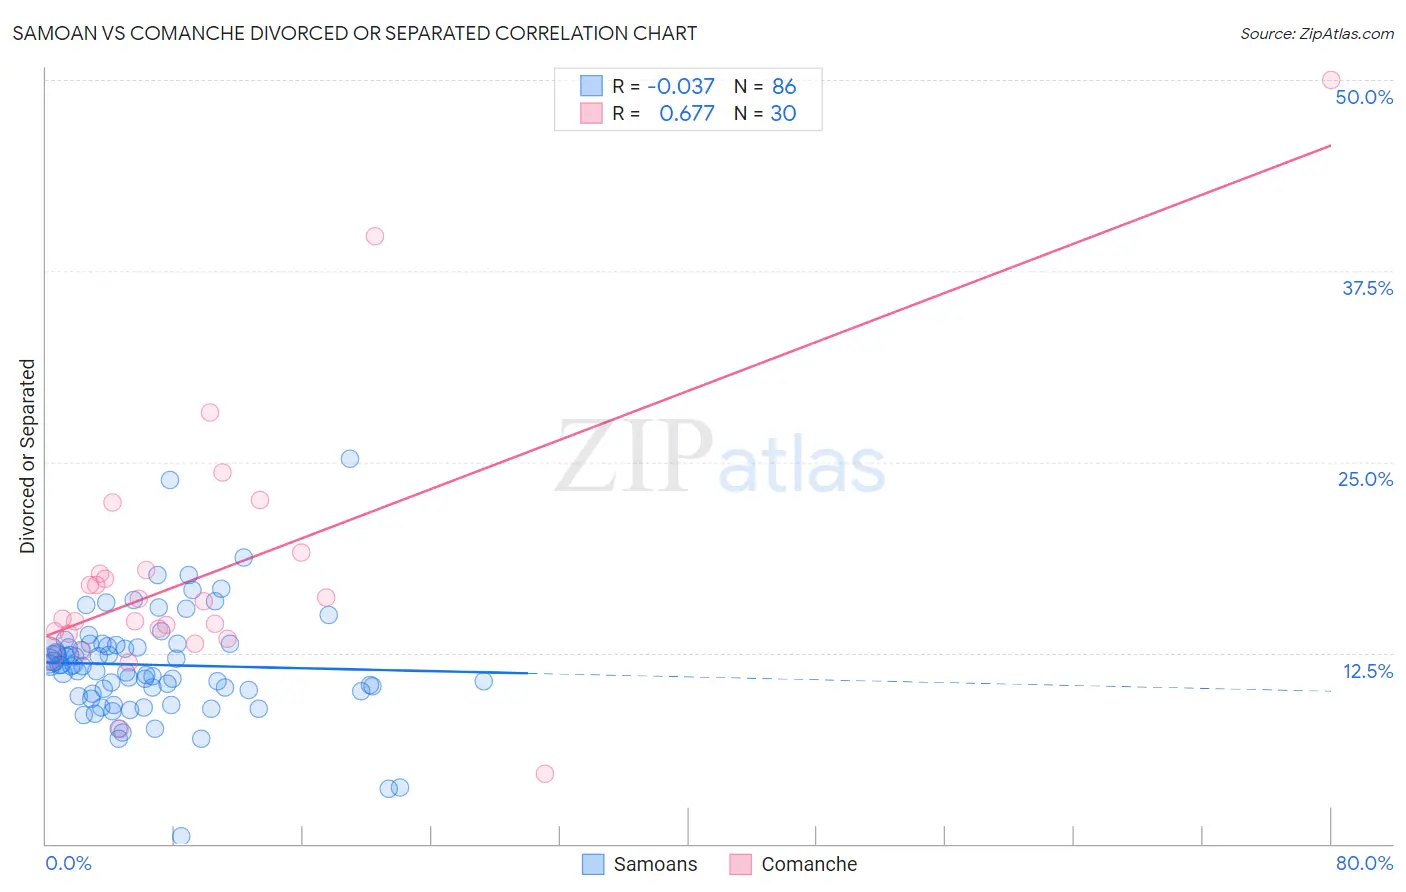
Samoan vs Comanche Divorced or Separated Correlation Chart
The statistical analysis conducted on geographies consisting of 225,171,159 people shows no correlation between the proportion of Samoans and percentage of population currently divorced or separated in the United States with a correlation coefficient (R) of -0.037 and weighted average of 12.0%. Similarly, the statistical analysis conducted on geographies consisting of 109,776,107 people shows a significant positive correlation between the proportion of Comanche and percentage of population currently divorced or separated in the United States with a correlation coefficient (R) of 0.677 and weighted average of 13.5%, a difference of 12.8%.
Divorced or Separated Correlation Summary
| Measurement | Samoan | Comanche |
| Minimum | 0.50% | 4.6% |
| Maximum | 25.2% | 50.0% |
| Range | 24.7% | 45.4% |
| Mean | 11.7% | 17.7% |
| Median | 11.7% | 15.3% |
| Interquartile 25% (IQ1) | 10.0% | 13.7% |
| Interquartile 75% (IQ3) | 13.0% | 18.0% |
| Interquartile Range (IQR) | 3.0% | 4.2% |
| Standard Deviation (Sample) | 3.6% | 8.8% |
| Standard Deviation (Population) | 3.6% | 8.6% |
Similar Demographics by Divorced or Separated
Demographics Similar to Samoans by Divorced or Separated
In terms of divorced or separated, the demographic groups most similar to Samoans are Marshallese (12.0%, a difference of 0.010%), Navajo (12.0%, a difference of 0.010%), Swiss (12.0%, a difference of 0.020%), Immigrants from Scotland (12.0%, a difference of 0.060%), and Icelander (12.0%, a difference of 0.070%).
| Demographics | Rating | Rank | Divorced or Separated |
| Japanese | 70.9 /100 | #155 | Good 12.0% |
| Hungarians | 70.3 /100 | #156 | Good 12.0% |
| Immigrants | Brazil | 68.8 /100 | #157 | Good 12.0% |
| Icelanders | 66.0 /100 | #158 | Good 12.0% |
| Immigrants | Barbados | 66.0 /100 | #159 | Good 12.0% |
| Immigrants | Scotland | 65.8 /100 | #160 | Good 12.0% |
| Marshallese | 64.6 /100 | #161 | Good 12.0% |
| Samoans | 64.3 /100 | #162 | Good 12.0% |
| Navajo | 63.9 /100 | #163 | Good 12.0% |
| Swiss | 63.6 /100 | #164 | Good 12.0% |
| German Russians | 61.8 /100 | #165 | Good 12.0% |
| Tohono O'odham | 60.4 /100 | #166 | Good 12.0% |
| Ethiopians | 58.5 /100 | #167 | Average 12.0% |
| Serbians | 57.1 /100 | #168 | Average 12.0% |
| Immigrants | Peru | 57.0 /100 | #169 | Average 12.0% |
Demographics Similar to Comanche by Divorced or Separated
In terms of divorced or separated, the demographic groups most similar to Comanche are Immigrants from Caribbean (13.6%, a difference of 0.38%), Immigrants from Congo (13.5%, a difference of 0.48%), Potawatomi (13.5%, a difference of 0.49%), Houma (13.6%, a difference of 0.53%), and Osage (13.4%, a difference of 0.55%).
| Demographics | Rating | Rank | Divorced or Separated |
| Cajuns | 0.0 /100 | #320 | Tragic 13.4% |
| Cheyenne | 0.0 /100 | #321 | Tragic 13.4% |
| Immigrants | Haiti | 0.0 /100 | #322 | Tragic 13.4% |
| U.S. Virgin Islanders | 0.0 /100 | #323 | Tragic 13.4% |
| Osage | 0.0 /100 | #324 | Tragic 13.4% |
| Potawatomi | 0.0 /100 | #325 | Tragic 13.5% |
| Immigrants | Congo | 0.0 /100 | #326 | Tragic 13.5% |
| Comanche | 0.0 /100 | #327 | Tragic 13.5% |
| Immigrants | Caribbean | 0.0 /100 | #328 | Tragic 13.6% |
| Houma | 0.0 /100 | #329 | Tragic 13.6% |
| Paiute | 0.0 /100 | #330 | Tragic 13.6% |
| Blacks/African Americans | 0.0 /100 | #331 | Tragic 13.6% |
| Cherokee | 0.0 /100 | #332 | Tragic 13.7% |
| Puerto Ricans | 0.0 /100 | #333 | Tragic 13.9% |
| Immigrants | Bahamas | 0.0 /100 | #334 | Tragic 13.9% |