Samoan vs Immigrants from Afghanistan Median Earnings
COMPARE
Samoan
Immigrants from Afghanistan
Median Earnings
Median Earnings Comparison
Samoans
Immigrants from Afghanistan
$44,206
MEDIAN EARNINGS
4.2/ 100
METRIC RATING
241st/ 347
METRIC RANK
$49,645
MEDIAN EARNINGS
98.9/ 100
METRIC RATING
99th/ 347
METRIC RANK
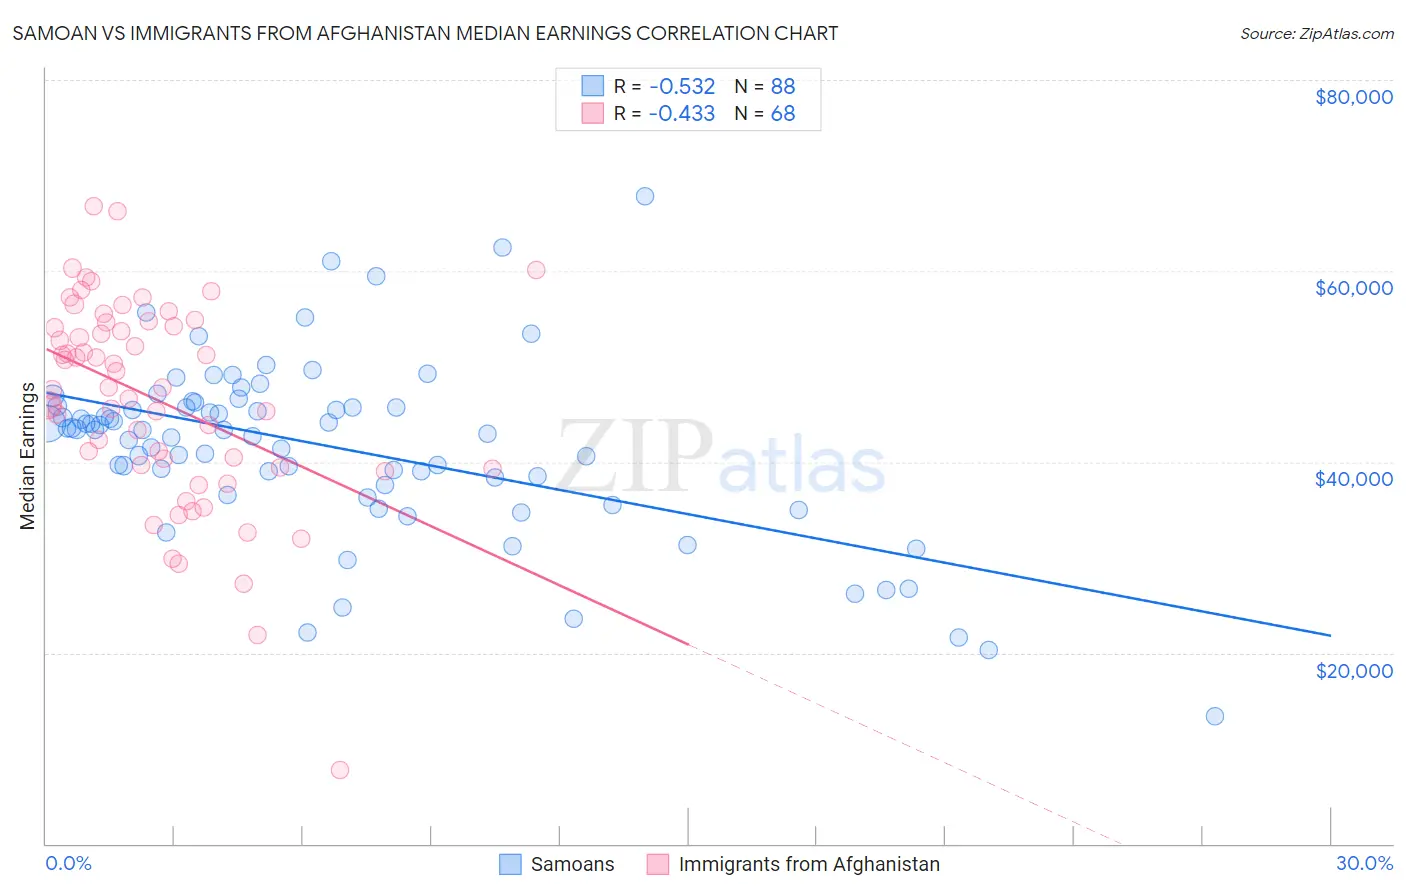
Samoan vs Immigrants from Afghanistan Median Earnings Correlation Chart
The statistical analysis conducted on geographies consisting of 225,197,093 people shows a substantial negative correlation between the proportion of Samoans and median earnings in the United States with a correlation coefficient (R) of -0.532 and weighted average of $44,206. Similarly, the statistical analysis conducted on geographies consisting of 147,645,000 people shows a moderate negative correlation between the proportion of Immigrants from Afghanistan and median earnings in the United States with a correlation coefficient (R) of -0.433 and weighted average of $49,645, a difference of 12.3%.
Median Earnings Correlation Summary
| Measurement | Samoan | Immigrants from Afghanistan |
| Minimum | $13,413 | $7,703 |
| Maximum | $67,875 | $66,757 |
| Range | $54,462 | $59,054 |
| Mean | $41,589 | $46,511 |
| Median | $43,332 | $47,775 |
| Interquartile 25% (IQ1) | $37,950 | $39,495 |
| Interquartile 75% (IQ3) | $45,824 | $54,376 |
| Interquartile Range (IQR) | $7,874 | $14,881 |
| Standard Deviation (Sample) | $9,289 | $10,763 |
| Standard Deviation (Population) | $9,236 | $10,683 |
Similar Demographics by Median Earnings
Demographics Similar to Samoans by Median Earnings
In terms of median earnings, the demographic groups most similar to Samoans are Aleut ($44,241, a difference of 0.080%), Immigrants from Venezuela ($44,163, a difference of 0.10%), Subsaharan African ($44,118, a difference of 0.20%), Nonimmigrants ($44,117, a difference of 0.20%), and Senegalese ($44,373, a difference of 0.38%).
| Demographics | Rating | Rank | Median Earnings |
| Cape Verdeans | 7.5 /100 | #234 | Tragic $44,640 |
| Venezuelans | 6.9 /100 | #235 | Tragic $44,580 |
| British West Indians | 6.7 /100 | #236 | Tragic $44,552 |
| Immigrants | Ecuador | 5.9 /100 | #237 | Tragic $44,462 |
| Sudanese | 5.6 /100 | #238 | Tragic $44,419 |
| Senegalese | 5.3 /100 | #239 | Tragic $44,373 |
| Aleuts | 4.4 /100 | #240 | Tragic $44,241 |
| Samoans | 4.2 /100 | #241 | Tragic $44,206 |
| Immigrants | Venezuela | 4.0 /100 | #242 | Tragic $44,163 |
| Sub-Saharan Africans | 3.7 /100 | #243 | Tragic $44,118 |
| Immigrants | Nonimmigrants | 3.7 /100 | #244 | Tragic $44,117 |
| Immigrants | Burma/Myanmar | 3.2 /100 | #245 | Tragic $43,998 |
| Immigrants | West Indies | 3.1 /100 | #246 | Tragic $43,989 |
| Immigrants | Cabo Verde | 3.0 /100 | #247 | Tragic $43,963 |
| Nepalese | 2.6 /100 | #248 | Tragic $43,860 |
Demographics Similar to Immigrants from Afghanistan by Median Earnings
In terms of median earnings, the demographic groups most similar to Immigrants from Afghanistan are Immigrants from Northern Africa ($49,648, a difference of 0.010%), Immigrants from Poland ($49,633, a difference of 0.020%), Immigrants from North Macedonia ($49,658, a difference of 0.030%), Jordanian ($49,632, a difference of 0.030%), and Immigrants from Lebanon ($49,682, a difference of 0.070%).
| Demographics | Rating | Rank | Median Earnings |
| Immigrants | Argentina | 99.2 /100 | #92 | Exceptional $49,841 |
| Armenians | 99.1 /100 | #93 | Exceptional $49,804 |
| Croatians | 99.0 /100 | #94 | Exceptional $49,724 |
| Immigrants | England | 99.0 /100 | #95 | Exceptional $49,722 |
| Immigrants | Lebanon | 99.0 /100 | #96 | Exceptional $49,682 |
| Immigrants | North Macedonia | 98.9 /100 | #97 | Exceptional $49,658 |
| Immigrants | Northern Africa | 98.9 /100 | #98 | Exceptional $49,648 |
| Immigrants | Afghanistan | 98.9 /100 | #99 | Exceptional $49,645 |
| Immigrants | Poland | 98.9 /100 | #100 | Exceptional $49,633 |
| Jordanians | 98.9 /100 | #101 | Exceptional $49,632 |
| Ethiopians | 98.8 /100 | #102 | Exceptional $49,572 |
| Austrians | 98.7 /100 | #103 | Exceptional $49,501 |
| Immigrants | Brazil | 98.6 /100 | #104 | Exceptional $49,463 |
| Immigrants | Western Asia | 98.4 /100 | #105 | Exceptional $49,389 |
| Immigrants | Albania | 98.4 /100 | #106 | Exceptional $49,377 |