New Zealander vs Comanche Median Earnings
COMPARE
New Zealander
Comanche
Median Earnings
Median Earnings Comparison
New Zealanders
Comanche
$51,246
MEDIAN EARNINGS
99.9/ 100
METRIC RATING
64th/ 347
METRIC RANK
$41,519
MEDIAN EARNINGS
0.1/ 100
METRIC RATING
289th/ 347
METRIC RANK
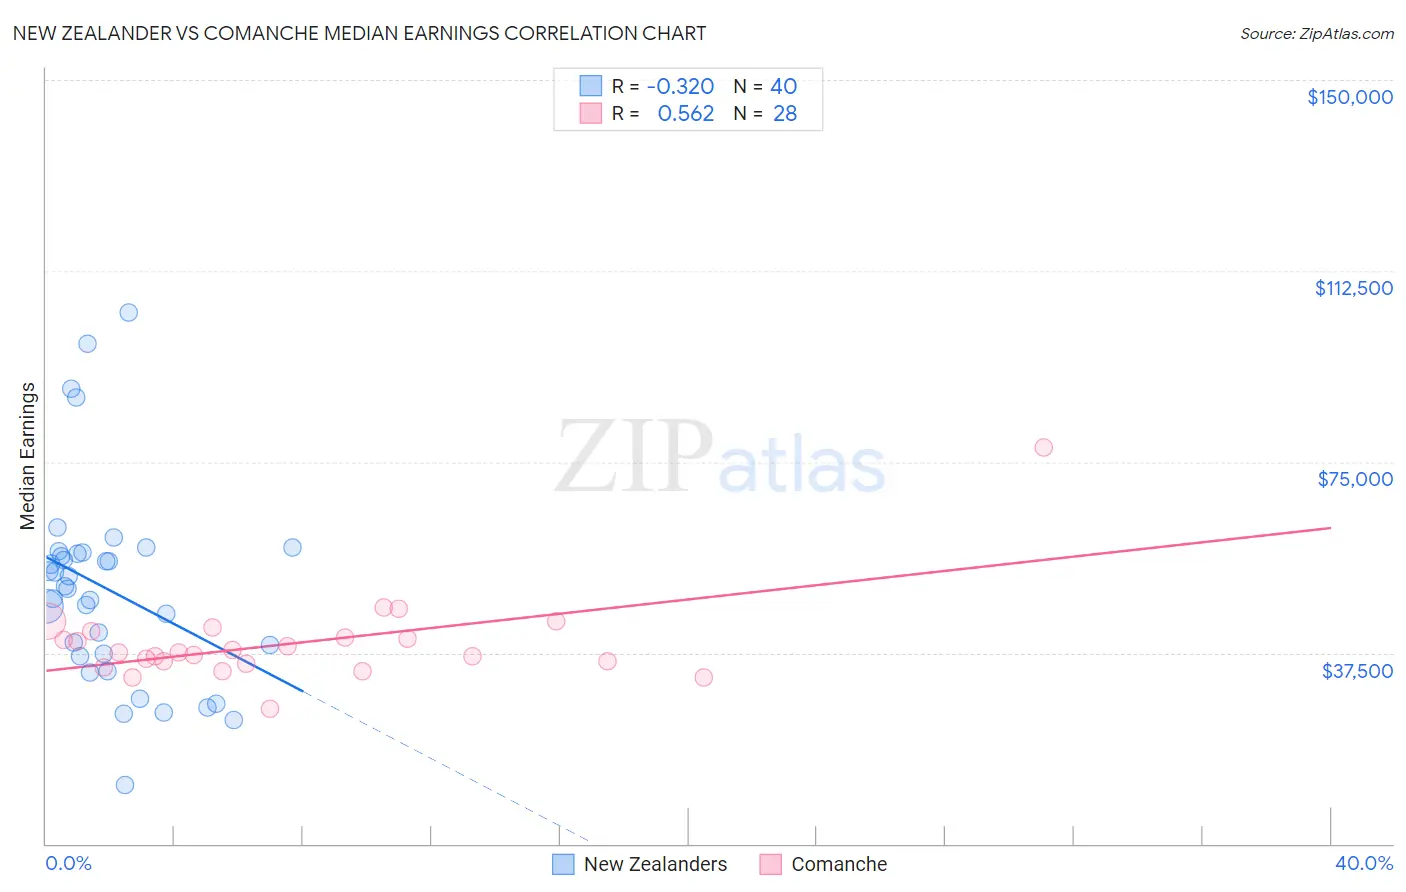
New Zealander vs Comanche Median Earnings Correlation Chart
The statistical analysis conducted on geographies consisting of 106,916,811 people shows a mild negative correlation between the proportion of New Zealanders and median earnings in the United States with a correlation coefficient (R) of -0.320 and weighted average of $51,246. Similarly, the statistical analysis conducted on geographies consisting of 109,778,903 people shows a substantial positive correlation between the proportion of Comanche and median earnings in the United States with a correlation coefficient (R) of 0.562 and weighted average of $41,519, a difference of 23.4%.
Median Earnings Correlation Summary
| Measurement | New Zealander | Comanche |
| Minimum | $11,591 | $26,595 |
| Maximum | $104,409 | $77,937 |
| Range | $92,818 | $51,342 |
| Mean | $49,845 | $39,371 |
| Median | $50,398 | $37,513 |
| Interquartile 25% (IQ1) | $37,107 | $35,556 |
| Interquartile 75% (IQ3) | $57,034 | $41,131 |
| Interquartile Range (IQR) | $19,927 | $5,575 |
| Standard Deviation (Sample) | $19,630 | $8,724 |
| Standard Deviation (Population) | $19,383 | $8,566 |
Similar Demographics by Median Earnings
Demographics Similar to New Zealanders by Median Earnings
In terms of median earnings, the demographic groups most similar to New Zealanders are Immigrants from Bulgaria ($51,318, a difference of 0.14%), Greek ($51,164, a difference of 0.16%), Immigrants from Romania ($51,337, a difference of 0.18%), Afghan ($51,112, a difference of 0.26%), and Immigrants from Spain ($51,092, a difference of 0.30%).
| Demographics | Rating | Rank | Median Earnings |
| Immigrants | Eastern Europe | 99.9 /100 | #57 | Exceptional $51,624 |
| Immigrants | Bolivia | 99.9 /100 | #58 | Exceptional $51,605 |
| Immigrants | Croatia | 99.9 /100 | #59 | Exceptional $51,581 |
| Immigrants | Serbia | 99.9 /100 | #60 | Exceptional $51,557 |
| Immigrants | Latvia | 99.9 /100 | #61 | Exceptional $51,555 |
| Immigrants | Romania | 99.9 /100 | #62 | Exceptional $51,337 |
| Immigrants | Bulgaria | 99.9 /100 | #63 | Exceptional $51,318 |
| New Zealanders | 99.9 /100 | #64 | Exceptional $51,246 |
| Greeks | 99.9 /100 | #65 | Exceptional $51,164 |
| Afghans | 99.9 /100 | #66 | Exceptional $51,112 |
| Immigrants | Spain | 99.9 /100 | #67 | Exceptional $51,092 |
| Paraguayans | 99.9 /100 | #68 | Exceptional $51,068 |
| Mongolians | 99.8 /100 | #69 | Exceptional $51,038 |
| Lithuanians | 99.8 /100 | #70 | Exceptional $50,991 |
| Immigrants | Ukraine | 99.8 /100 | #71 | Exceptional $50,984 |
Demographics Similar to Comanche by Median Earnings
In terms of median earnings, the demographic groups most similar to Comanche are Paiute ($41,508, a difference of 0.030%), Immigrants from Dominican Republic ($41,554, a difference of 0.080%), Central American Indian ($41,474, a difference of 0.11%), U.S. Virgin Islander ($41,448, a difference of 0.17%), and Indonesian ($41,701, a difference of 0.44%).
| Demographics | Rating | Rank | Median Earnings |
| Africans | 0.2 /100 | #282 | Tragic $41,955 |
| Dominicans | 0.2 /100 | #283 | Tragic $41,864 |
| Blackfeet | 0.2 /100 | #284 | Tragic $41,822 |
| Immigrants | Nicaragua | 0.1 /100 | #285 | Tragic $41,737 |
| Mexican American Indians | 0.1 /100 | #286 | Tragic $41,719 |
| Indonesians | 0.1 /100 | #287 | Tragic $41,701 |
| Immigrants | Dominican Republic | 0.1 /100 | #288 | Tragic $41,554 |
| Comanche | 0.1 /100 | #289 | Tragic $41,519 |
| Paiute | 0.1 /100 | #290 | Tragic $41,508 |
| Central American Indians | 0.1 /100 | #291 | Tragic $41,474 |
| U.S. Virgin Islanders | 0.1 /100 | #292 | Tragic $41,448 |
| Immigrants | Zaire | 0.1 /100 | #293 | Tragic $41,325 |
| Potawatomi | 0.1 /100 | #294 | Tragic $41,288 |
| Bangladeshis | 0.1 /100 | #295 | Tragic $41,263 |
| Cherokee | 0.1 /100 | #296 | Tragic $41,252 |