Immigrants from Haiti vs Comanche Median Earnings
COMPARE
Immigrants from Haiti
Comanche
Median Earnings
Median Earnings Comparison
Immigrants from Haiti
Comanche
$40,550
MEDIAN EARNINGS
0.0/ 100
METRIC RATING
309th/ 347
METRIC RANK
$41,519
MEDIAN EARNINGS
0.1/ 100
METRIC RATING
289th/ 347
METRIC RANK
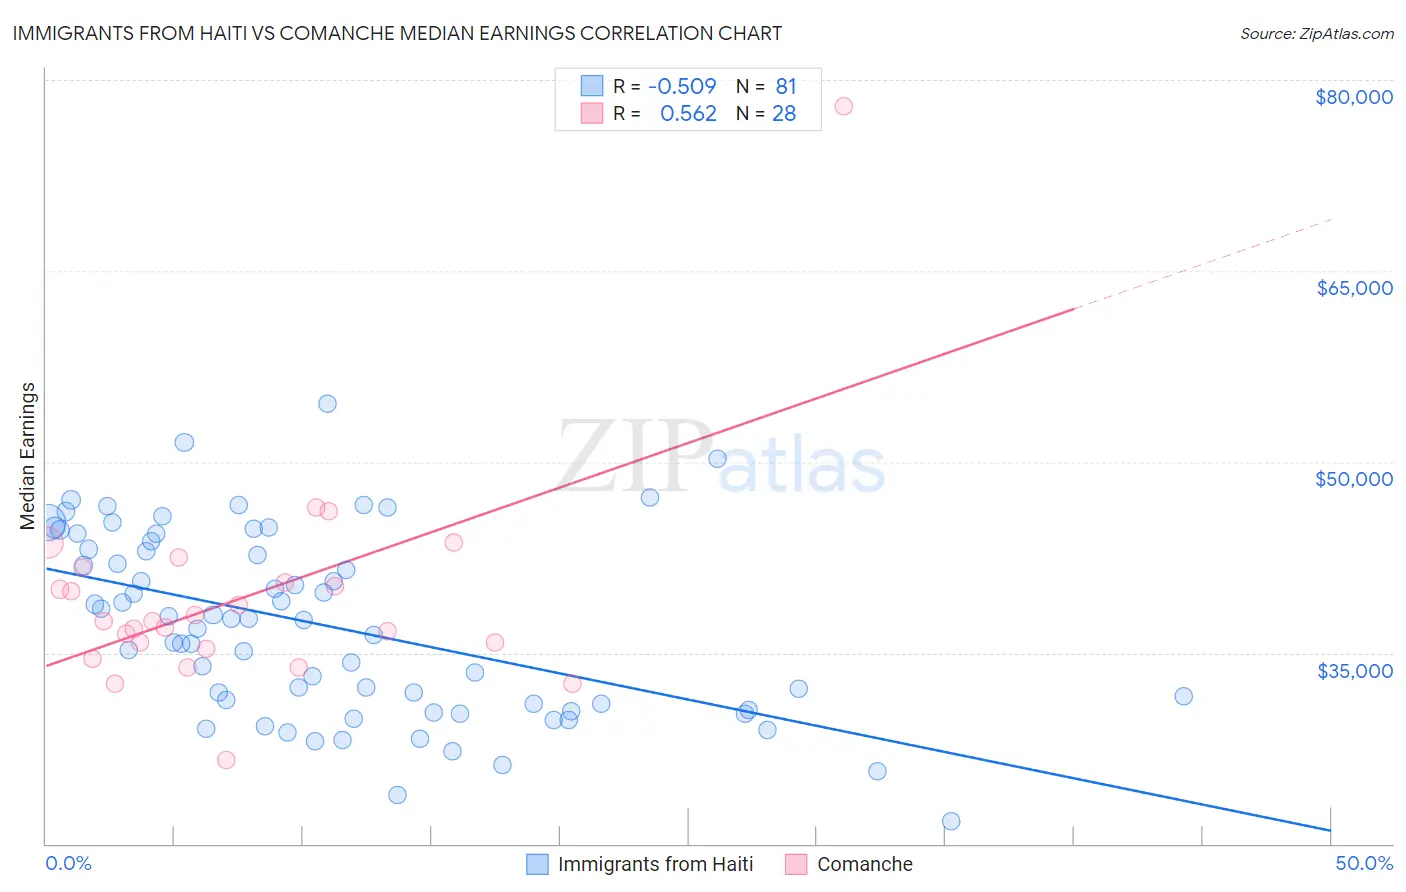
Immigrants from Haiti vs Comanche Median Earnings Correlation Chart
The statistical analysis conducted on geographies consisting of 225,267,709 people shows a substantial negative correlation between the proportion of Immigrants from Haiti and median earnings in the United States with a correlation coefficient (R) of -0.509 and weighted average of $40,550. Similarly, the statistical analysis conducted on geographies consisting of 109,778,903 people shows a substantial positive correlation between the proportion of Comanche and median earnings in the United States with a correlation coefficient (R) of 0.562 and weighted average of $41,519, a difference of 2.4%.
Median Earnings Correlation Summary
| Measurement | Immigrants from Haiti | Comanche |
| Minimum | $21,741 | $26,595 |
| Maximum | $54,545 | $77,937 |
| Range | $32,804 | $51,342 |
| Mean | $37,122 | $39,371 |
| Median | $37,540 | $37,513 |
| Interquartile 25% (IQ1) | $30,770 | $35,556 |
| Interquartile 75% (IQ3) | $43,463 | $41,131 |
| Interquartile Range (IQR) | $12,693 | $5,575 |
| Standard Deviation (Sample) | $7,185 | $8,724 |
| Standard Deviation (Population) | $7,140 | $8,566 |
Demographics Similar to Immigrants from Haiti and Comanche by Median Earnings
In terms of median earnings, the demographic groups most similar to Immigrants from Haiti are Cuban ($40,619, a difference of 0.17%), Honduran ($40,638, a difference of 0.22%), Yaqui ($40,647, a difference of 0.24%), Chickasaw ($40,672, a difference of 0.30%), and Immigrants from Guatemala ($40,851, a difference of 0.74%). Similarly, the demographic groups most similar to Comanche are Paiute ($41,508, a difference of 0.030%), Central American Indian ($41,474, a difference of 0.11%), U.S. Virgin Islander ($41,448, a difference of 0.17%), Immigrants from Zaire ($41,325, a difference of 0.47%), and Potawatomi ($41,288, a difference of 0.56%).
| Demographics | Rating | Rank | Median Earnings |
| Comanche | 0.1 /100 | #289 | Tragic $41,519 |
| Paiute | 0.1 /100 | #290 | Tragic $41,508 |
| Central American Indians | 0.1 /100 | #291 | Tragic $41,474 |
| U.S. Virgin Islanders | 0.1 /100 | #292 | Tragic $41,448 |
| Immigrants | Zaire | 0.1 /100 | #293 | Tragic $41,325 |
| Potawatomi | 0.1 /100 | #294 | Tragic $41,288 |
| Bangladeshis | 0.1 /100 | #295 | Tragic $41,263 |
| Cherokee | 0.1 /100 | #296 | Tragic $41,252 |
| Guatemalans | 0.1 /100 | #297 | Tragic $41,205 |
| Immigrants | Micronesia | 0.1 /100 | #298 | Tragic $41,133 |
| Immigrants | Caribbean | 0.1 /100 | #299 | Tragic $41,119 |
| Ute | 0.1 /100 | #300 | Tragic $41,051 |
| Immigrants | Latin America | 0.1 /100 | #301 | Tragic $41,049 |
| Shoshone | 0.0 /100 | #302 | Tragic $40,932 |
| Haitians | 0.0 /100 | #303 | Tragic $40,918 |
| Immigrants | Guatemala | 0.0 /100 | #304 | Tragic $40,851 |
| Chickasaw | 0.0 /100 | #305 | Tragic $40,672 |
| Yaqui | 0.0 /100 | #306 | Tragic $40,647 |
| Hondurans | 0.0 /100 | #307 | Tragic $40,638 |
| Cubans | 0.0 /100 | #308 | Tragic $40,619 |
| Immigrants | Haiti | 0.0 /100 | #309 | Tragic $40,550 |