Kiowa vs Comanche Median Earnings
COMPARE
Kiowa
Comanche
Median Earnings
Median Earnings Comparison
Kiowa
Comanche
$39,232
MEDIAN EARNINGS
0.0/ 100
METRIC RATING
329th/ 347
METRIC RANK
$41,519
MEDIAN EARNINGS
0.1/ 100
METRIC RATING
289th/ 347
METRIC RANK
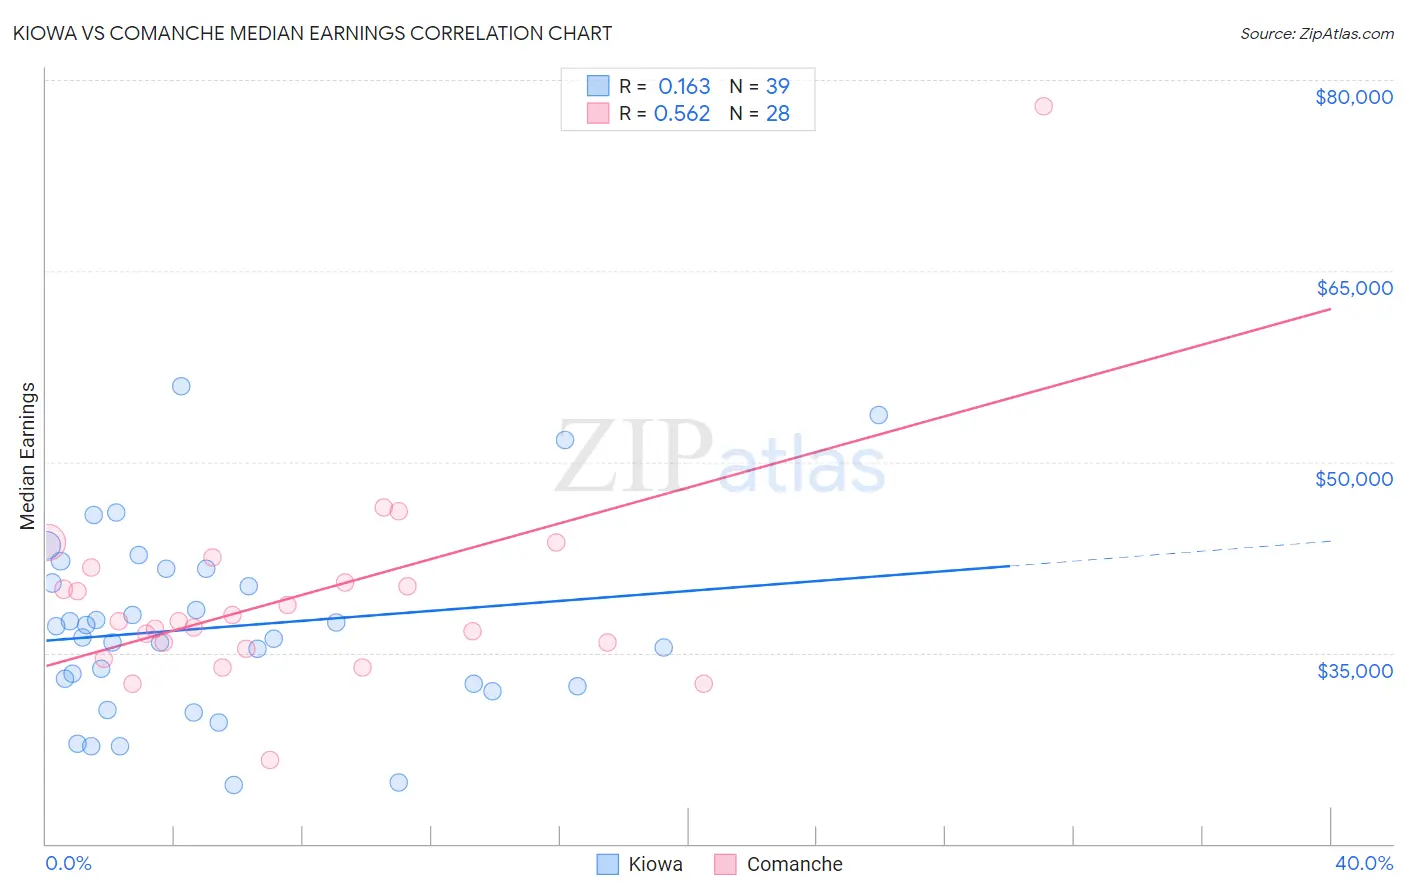
Kiowa vs Comanche Median Earnings Correlation Chart
The statistical analysis conducted on geographies consisting of 56,100,586 people shows a poor positive correlation between the proportion of Kiowa and median earnings in the United States with a correlation coefficient (R) of 0.163 and weighted average of $39,232. Similarly, the statistical analysis conducted on geographies consisting of 109,778,903 people shows a substantial positive correlation between the proportion of Comanche and median earnings in the United States with a correlation coefficient (R) of 0.562 and weighted average of $41,519, a difference of 5.8%.
Median Earnings Correlation Summary
| Measurement | Kiowa | Comanche |
| Minimum | $24,615 | $26,595 |
| Maximum | $55,938 | $77,937 |
| Range | $31,323 | $51,342 |
| Mean | $37,003 | $39,371 |
| Median | $36,193 | $37,513 |
| Interquartile 25% (IQ1) | $32,335 | $35,556 |
| Interquartile 75% (IQ3) | $41,599 | $41,131 |
| Interquartile Range (IQR) | $9,264 | $5,575 |
| Standard Deviation (Sample) | $7,253 | $8,724 |
| Standard Deviation (Population) | $7,159 | $8,566 |
Similar Demographics by Median Earnings
Demographics Similar to Kiowa by Median Earnings
In terms of median earnings, the demographic groups most similar to Kiowa are Immigrants from Congo ($39,169, a difference of 0.16%), Immigrants from Mexico ($39,114, a difference of 0.30%), Yakama ($39,107, a difference of 0.32%), Sioux ($39,448, a difference of 0.55%), and Houma ($38,949, a difference of 0.73%).
| Demographics | Rating | Rank | Median Earnings |
| Immigrants | Central America | 0.0 /100 | #322 | Tragic $39,762 |
| Bahamians | 0.0 /100 | #323 | Tragic $39,735 |
| Ottawa | 0.0 /100 | #324 | Tragic $39,721 |
| Creek | 0.0 /100 | #325 | Tragic $39,648 |
| Immigrants | Yemen | 0.0 /100 | #326 | Tragic $39,540 |
| Yuman | 0.0 /100 | #327 | Tragic $39,523 |
| Sioux | 0.0 /100 | #328 | Tragic $39,448 |
| Kiowa | 0.0 /100 | #329 | Tragic $39,232 |
| Immigrants | Congo | 0.0 /100 | #330 | Tragic $39,169 |
| Immigrants | Mexico | 0.0 /100 | #331 | Tragic $39,114 |
| Yakama | 0.0 /100 | #332 | Tragic $39,107 |
| Houma | 0.0 /100 | #333 | Tragic $38,949 |
| Spanish American Indians | 0.0 /100 | #334 | Tragic $38,907 |
| Natives/Alaskans | 0.0 /100 | #335 | Tragic $38,896 |
| Crow | 0.0 /100 | #336 | Tragic $38,707 |
Demographics Similar to Comanche by Median Earnings
In terms of median earnings, the demographic groups most similar to Comanche are Paiute ($41,508, a difference of 0.030%), Immigrants from Dominican Republic ($41,554, a difference of 0.080%), Central American Indian ($41,474, a difference of 0.11%), U.S. Virgin Islander ($41,448, a difference of 0.17%), and Indonesian ($41,701, a difference of 0.44%).
| Demographics | Rating | Rank | Median Earnings |
| Africans | 0.2 /100 | #282 | Tragic $41,955 |
| Dominicans | 0.2 /100 | #283 | Tragic $41,864 |
| Blackfeet | 0.2 /100 | #284 | Tragic $41,822 |
| Immigrants | Nicaragua | 0.1 /100 | #285 | Tragic $41,737 |
| Mexican American Indians | 0.1 /100 | #286 | Tragic $41,719 |
| Indonesians | 0.1 /100 | #287 | Tragic $41,701 |
| Immigrants | Dominican Republic | 0.1 /100 | #288 | Tragic $41,554 |
| Comanche | 0.1 /100 | #289 | Tragic $41,519 |
| Paiute | 0.1 /100 | #290 | Tragic $41,508 |
| Central American Indians | 0.1 /100 | #291 | Tragic $41,474 |
| U.S. Virgin Islanders | 0.1 /100 | #292 | Tragic $41,448 |
| Immigrants | Zaire | 0.1 /100 | #293 | Tragic $41,325 |
| Potawatomi | 0.1 /100 | #294 | Tragic $41,288 |
| Bangladeshis | 0.1 /100 | #295 | Tragic $41,263 |
| Cherokee | 0.1 /100 | #296 | Tragic $41,252 |