Samoan vs Comanche Unemployment Among Ages 35 to 44 years
COMPARE
Samoan
Comanche
Unemployment Among Ages 35 to 44 years
Unemployment Among Ages 35 to 44 years Comparison
Samoans
Comanche
5.0%
UNEMPLOYMENT AMONG AGES 35 TO 44 YEARS
1.8/ 100
METRIC RATING
228th/ 347
METRIC RANK
5.2%
UNEMPLOYMENT AMONG AGES 35 TO 44 YEARS
0.2/ 100
METRIC RATING
251st/ 347
METRIC RANK
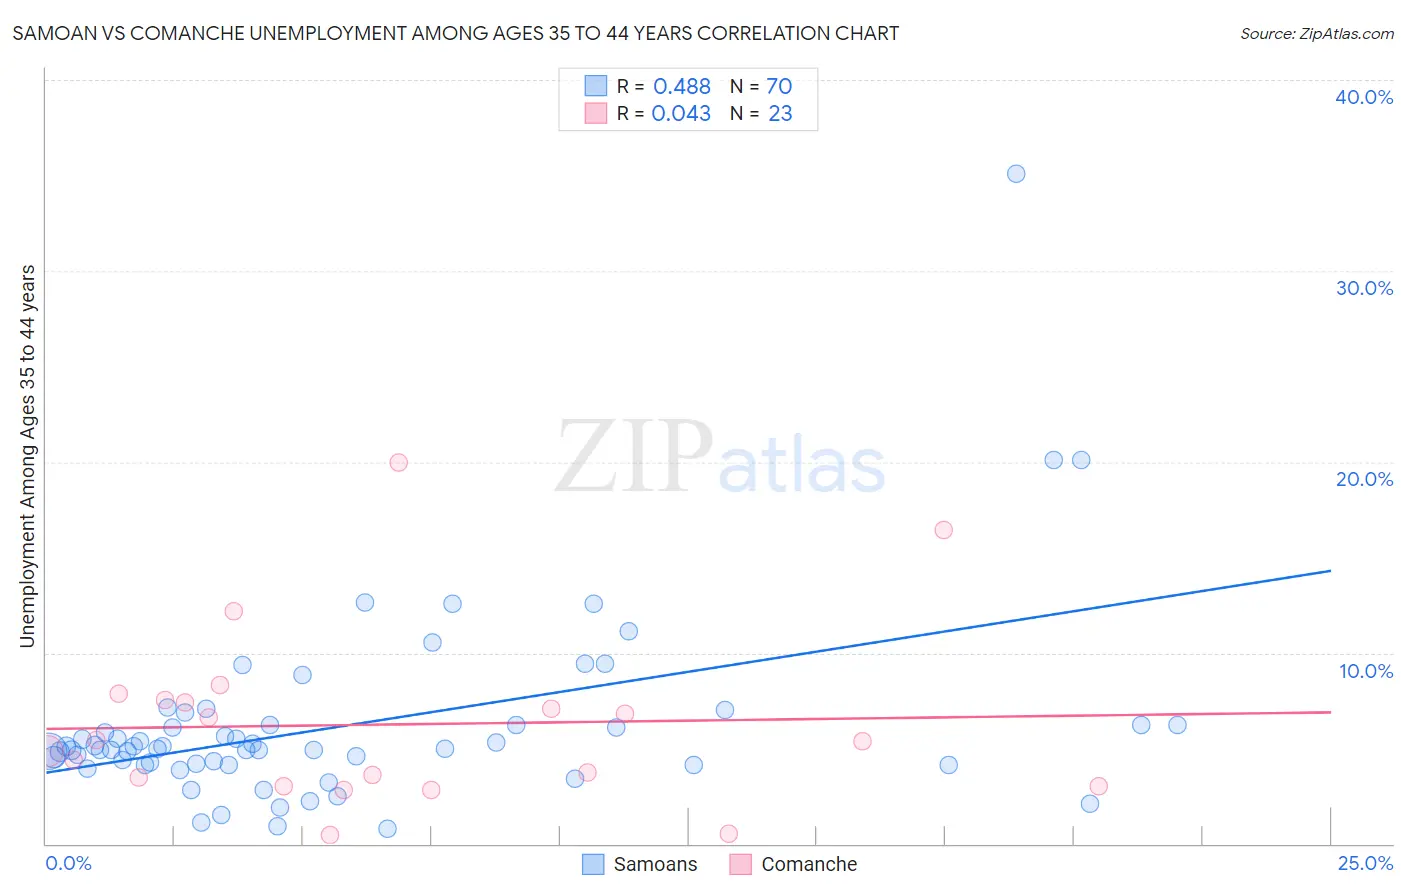
Samoan vs Comanche Unemployment Among Ages 35 to 44 years Correlation Chart
The statistical analysis conducted on geographies consisting of 222,580,294 people shows a moderate positive correlation between the proportion of Samoans and unemployment rate among population between the ages 35 and 44 in the United States with a correlation coefficient (R) of 0.488 and weighted average of 5.0%. Similarly, the statistical analysis conducted on geographies consisting of 108,588,837 people shows no correlation between the proportion of Comanche and unemployment rate among population between the ages 35 and 44 in the United States with a correlation coefficient (R) of 0.043 and weighted average of 5.2%, a difference of 3.8%.
Unemployment Among Ages 35 to 44 years Correlation Summary
| Measurement | Samoan | Comanche |
| Minimum | 0.80% | 0.44% |
| Maximum | 35.1% | 20.0% |
| Range | 34.3% | 19.6% |
| Mean | 6.2% | 6.2% |
| Median | 5.0% | 5.4% |
| Interquartile 25% (IQ1) | 4.1% | 3.0% |
| Interquartile 75% (IQ3) | 6.2% | 7.5% |
| Interquartile Range (IQR) | 2.1% | 4.5% |
| Standard Deviation (Sample) | 5.0% | 4.7% |
| Standard Deviation (Population) | 5.0% | 4.6% |
Similar Demographics by Unemployment Among Ages 35 to 44 years
Demographics Similar to Samoans by Unemployment Among Ages 35 to 44 years
In terms of unemployment among ages 35 to 44 years, the demographic groups most similar to Samoans are Immigrants from Uzbekistan (5.0%, a difference of 0.15%), Immigrants from Cambodia (5.0%, a difference of 0.28%), Liberian (5.1%, a difference of 0.56%), Japanese (5.1%, a difference of 0.59%), and Potawatomi (5.0%, a difference of 0.62%).
| Demographics | Rating | Rank | Unemployment Among Ages 35 to 44 years |
| Bermudans | 3.9 /100 | #221 | Tragic 5.0% |
| Hmong | 3.5 /100 | #222 | Tragic 5.0% |
| Immigrants | Panama | 3.3 /100 | #223 | Tragic 5.0% |
| Panamanians | 2.9 /100 | #224 | Tragic 5.0% |
| Immigrants | Lebanon | 2.7 /100 | #225 | Tragic 5.0% |
| Potawatomi | 2.5 /100 | #226 | Tragic 5.0% |
| Immigrants | Uzbekistan | 1.9 /100 | #227 | Tragic 5.0% |
| Samoans | 1.8 /100 | #228 | Tragic 5.0% |
| Immigrants | Cambodia | 1.5 /100 | #229 | Tragic 5.0% |
| Liberians | 1.3 /100 | #230 | Tragic 5.1% |
| Japanese | 1.2 /100 | #231 | Tragic 5.1% |
| Iroquois | 1.2 /100 | #232 | Tragic 5.1% |
| Immigrants | Nigeria | 1.2 /100 | #233 | Tragic 5.1% |
| Portuguese | 1.1 /100 | #234 | Tragic 5.1% |
| Guamanians/Chamorros | 0.9 /100 | #235 | Tragic 5.1% |
Demographics Similar to Comanche by Unemployment Among Ages 35 to 44 years
In terms of unemployment among ages 35 to 44 years, the demographic groups most similar to Comanche are Armenian (5.2%, a difference of 0.13%), Mexican American Indian (5.2%, a difference of 0.15%), Immigrants from Bahamas (5.2%, a difference of 0.18%), Cherokee (5.2%, a difference of 0.23%), and Immigrants from El Salvador (5.2%, a difference of 0.44%).
| Demographics | Rating | Rank | Unemployment Among Ages 35 to 44 years |
| Guatemalans | 0.4 /100 | #244 | Tragic 5.1% |
| Bahamians | 0.4 /100 | #245 | Tragic 5.2% |
| Immigrants | Guatemala | 0.4 /100 | #246 | Tragic 5.2% |
| Immigrants | Somalia | 0.3 /100 | #247 | Tragic 5.2% |
| Alsatians | 0.2 /100 | #248 | Tragic 5.2% |
| Immigrants | Liberia | 0.2 /100 | #249 | Tragic 5.2% |
| Immigrants | El Salvador | 0.2 /100 | #250 | Tragic 5.2% |
| Comanche | 0.2 /100 | #251 | Tragic 5.2% |
| Armenians | 0.2 /100 | #252 | Tragic 5.2% |
| Mexican American Indians | 0.2 /100 | #253 | Tragic 5.2% |
| Immigrants | Bahamas | 0.2 /100 | #254 | Tragic 5.2% |
| Cherokee | 0.2 /100 | #255 | Tragic 5.2% |
| Seminole | 0.1 /100 | #256 | Tragic 5.2% |
| Immigrants | Fiji | 0.1 /100 | #257 | Tragic 5.3% |
| Immigrants | Latin America | 0.1 /100 | #258 | Tragic 5.3% |