Samoan vs Immigrants from Australia Median Earnings
COMPARE
Samoan
Immigrants from Australia
Median Earnings
Median Earnings Comparison
Samoans
Immigrants from Australia
$44,206
MEDIAN EARNINGS
4.2/ 100
METRIC RATING
241st/ 347
METRIC RANK
$56,305
MEDIAN EARNINGS
100.0/ 100
METRIC RATING
14th/ 347
METRIC RANK
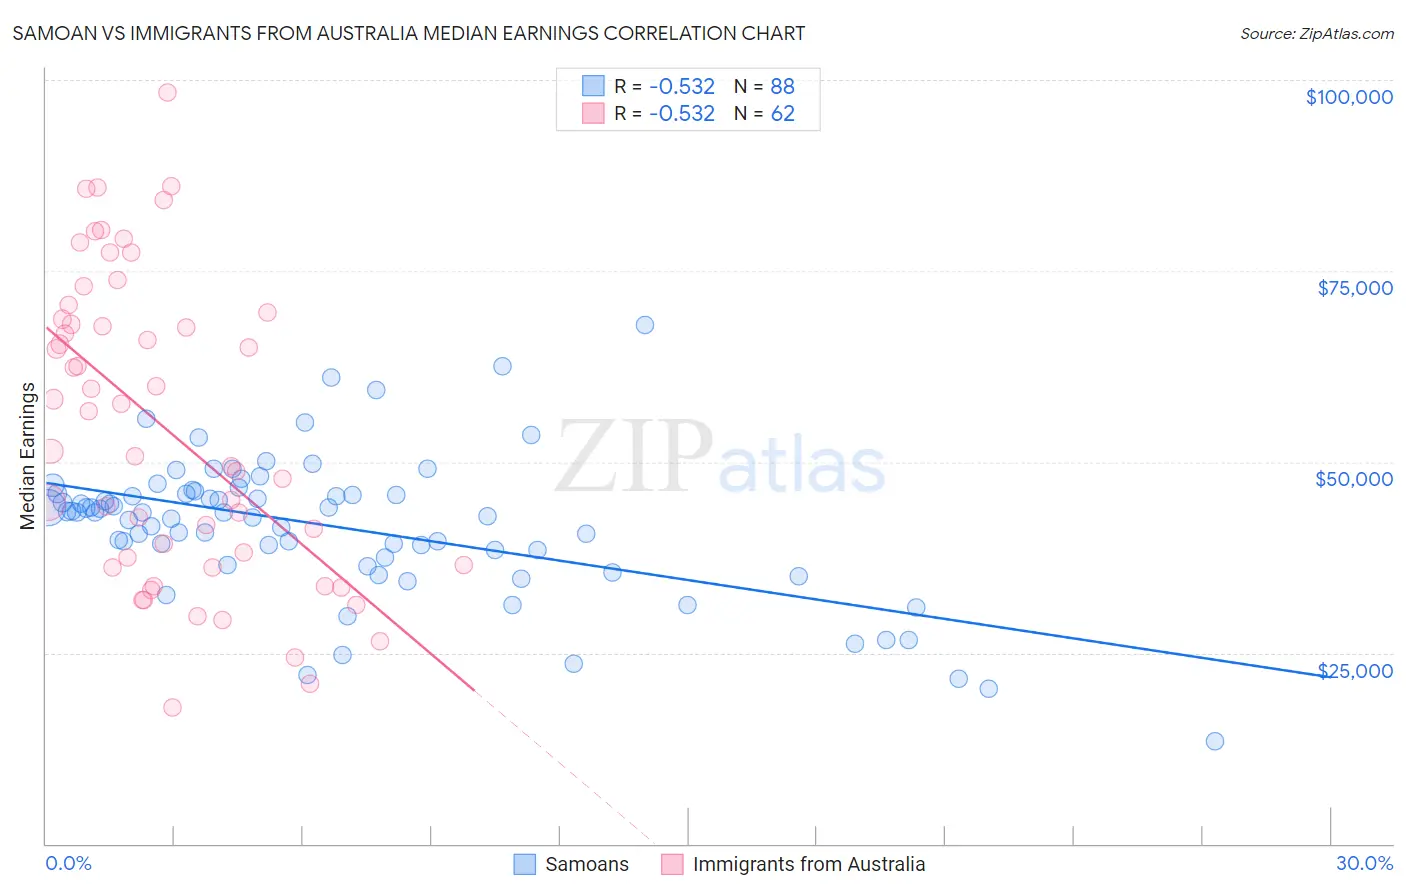
Samoan vs Immigrants from Australia Median Earnings Correlation Chart
The statistical analysis conducted on geographies consisting of 225,197,093 people shows a substantial negative correlation between the proportion of Samoans and median earnings in the United States with a correlation coefficient (R) of -0.532 and weighted average of $44,206. Similarly, the statistical analysis conducted on geographies consisting of 227,197,451 people shows a substantial negative correlation between the proportion of Immigrants from Australia and median earnings in the United States with a correlation coefficient (R) of -0.532 and weighted average of $56,305, a difference of 27.4%.
Median Earnings Correlation Summary
| Measurement | Samoan | Immigrants from Australia |
| Minimum | $13,413 | $17,795 |
| Maximum | $67,875 | $98,400 |
| Range | $54,462 | $80,605 |
| Mean | $41,589 | $54,359 |
| Median | $43,332 | $54,001 |
| Interquartile 25% (IQ1) | $37,950 | $36,563 |
| Interquartile 75% (IQ3) | $45,824 | $68,667 |
| Interquartile Range (IQR) | $7,874 | $32,104 |
| Standard Deviation (Sample) | $9,289 | $19,682 |
| Standard Deviation (Population) | $9,236 | $19,523 |
Similar Demographics by Median Earnings
Demographics Similar to Samoans by Median Earnings
In terms of median earnings, the demographic groups most similar to Samoans are Aleut ($44,241, a difference of 0.080%), Immigrants from Venezuela ($44,163, a difference of 0.10%), Subsaharan African ($44,118, a difference of 0.20%), Nonimmigrants ($44,117, a difference of 0.20%), and Senegalese ($44,373, a difference of 0.38%).
| Demographics | Rating | Rank | Median Earnings |
| Cape Verdeans | 7.5 /100 | #234 | Tragic $44,640 |
| Venezuelans | 6.9 /100 | #235 | Tragic $44,580 |
| British West Indians | 6.7 /100 | #236 | Tragic $44,552 |
| Immigrants | Ecuador | 5.9 /100 | #237 | Tragic $44,462 |
| Sudanese | 5.6 /100 | #238 | Tragic $44,419 |
| Senegalese | 5.3 /100 | #239 | Tragic $44,373 |
| Aleuts | 4.4 /100 | #240 | Tragic $44,241 |
| Samoans | 4.2 /100 | #241 | Tragic $44,206 |
| Immigrants | Venezuela | 4.0 /100 | #242 | Tragic $44,163 |
| Sub-Saharan Africans | 3.7 /100 | #243 | Tragic $44,118 |
| Immigrants | Nonimmigrants | 3.7 /100 | #244 | Tragic $44,117 |
| Immigrants | Burma/Myanmar | 3.2 /100 | #245 | Tragic $43,998 |
| Immigrants | West Indies | 3.1 /100 | #246 | Tragic $43,989 |
| Immigrants | Cabo Verde | 3.0 /100 | #247 | Tragic $43,963 |
| Nepalese | 2.6 /100 | #248 | Tragic $43,860 |
Demographics Similar to Immigrants from Australia by Median Earnings
In terms of median earnings, the demographic groups most similar to Immigrants from Australia are Indian (Asian) ($56,253, a difference of 0.090%), Immigrants from Eastern Asia ($56,183, a difference of 0.22%), Immigrants from China ($56,638, a difference of 0.59%), Immigrants from Ireland ($56,854, a difference of 0.97%), and Immigrants from Israel ($57,034, a difference of 1.3%).
| Demographics | Rating | Rank | Median Earnings |
| Iranians | 100.0 /100 | #7 | Exceptional $58,474 |
| Immigrants | Iran | 100.0 /100 | #8 | Exceptional $57,612 |
| Okinawans | 100.0 /100 | #9 | Exceptional $57,550 |
| Immigrants | South Central Asia | 100.0 /100 | #10 | Exceptional $57,114 |
| Immigrants | Israel | 100.0 /100 | #11 | Exceptional $57,034 |
| Immigrants | Ireland | 100.0 /100 | #12 | Exceptional $56,854 |
| Immigrants | China | 100.0 /100 | #13 | Exceptional $56,638 |
| Immigrants | Australia | 100.0 /100 | #14 | Exceptional $56,305 |
| Indians (Asian) | 100.0 /100 | #15 | Exceptional $56,253 |
| Immigrants | Eastern Asia | 100.0 /100 | #16 | Exceptional $56,183 |
| Eastern Europeans | 100.0 /100 | #17 | Exceptional $55,084 |
| Immigrants | Japan | 100.0 /100 | #18 | Exceptional $54,938 |
| Immigrants | Belgium | 100.0 /100 | #19 | Exceptional $54,679 |
| Cypriots | 100.0 /100 | #20 | Exceptional $54,589 |
| Burmese | 100.0 /100 | #21 | Exceptional $54,559 |