Salvadoran vs Indian (Asian) Median Female Earnings
COMPARE
Salvadoran
Indian (Asian)
Median Female Earnings
Median Female Earnings Comparison
Salvadorans
Indians (Asian)
$37,083
MEDIAN FEMALE EARNINGS
0.4/ 100
METRIC RATING
264th/ 347
METRIC RANK
$46,481
MEDIAN FEMALE EARNINGS
100.0/ 100
METRIC RATING
16th/ 347
METRIC RANK
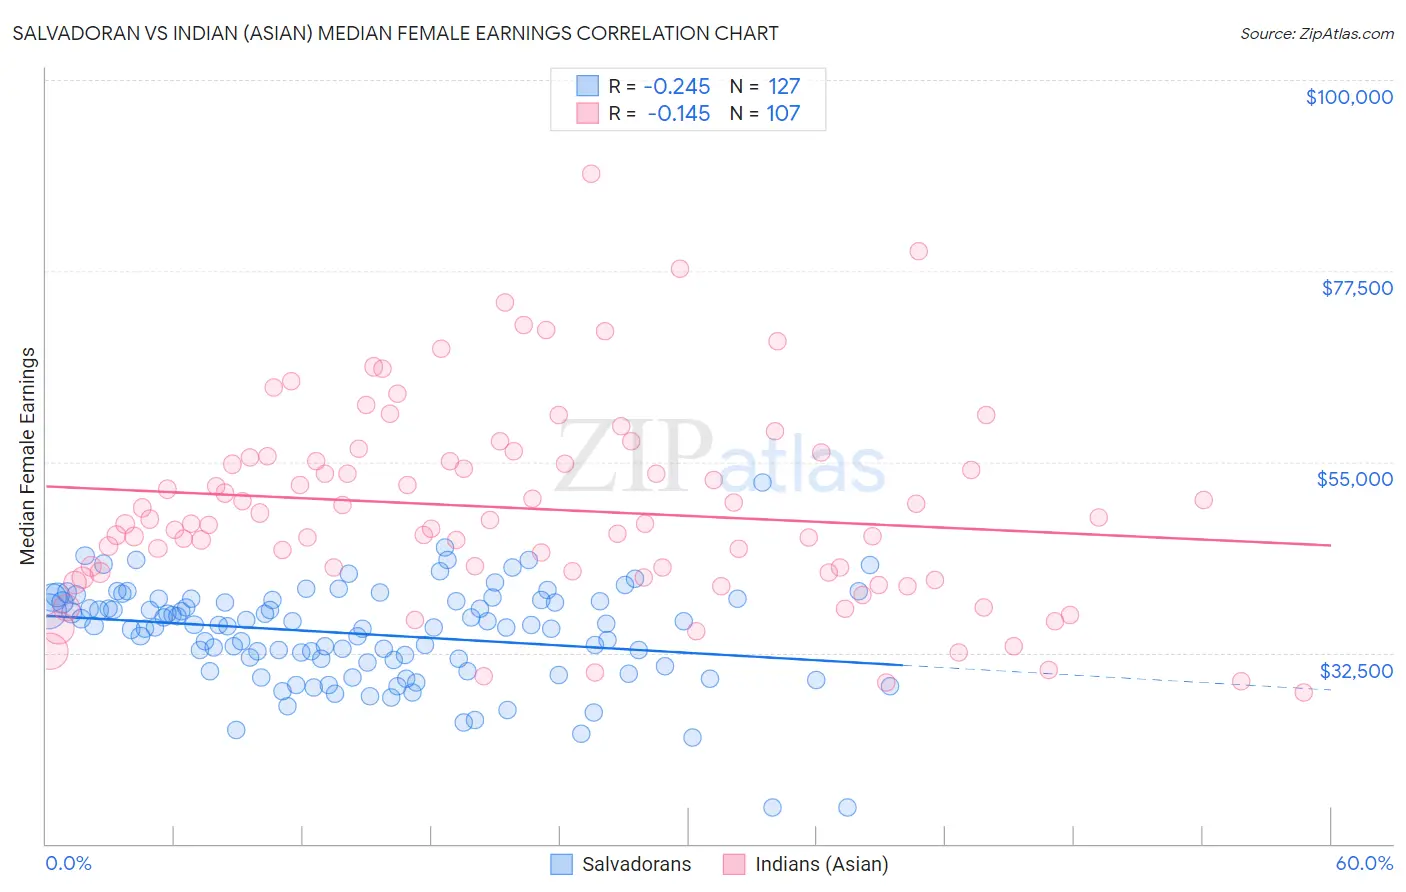
Salvadoran vs Indian (Asian) Median Female Earnings Correlation Chart
The statistical analysis conducted on geographies consisting of 398,898,517 people shows a weak negative correlation between the proportion of Salvadorans and median female earnings in the United States with a correlation coefficient (R) of -0.245 and weighted average of $37,083. Similarly, the statistical analysis conducted on geographies consisting of 494,787,725 people shows a poor negative correlation between the proportion of Indians (Asian) and median female earnings in the United States with a correlation coefficient (R) of -0.145 and weighted average of $46,481, a difference of 25.3%.
Median Female Earnings Correlation Summary
| Measurement | Salvadoran | Indian (Asian) |
| Minimum | $14,245 | $27,791 |
| Maximum | $52,604 | $88,889 |
| Range | $38,359 | $61,098 |
| Mean | $34,711 | $49,511 |
| Median | $35,673 | $47,694 |
| Interquartile 25% (IQ1) | $31,372 | $42,024 |
| Interquartile 75% (IQ3) | $38,695 | $55,457 |
| Interquartile Range (IQR) | $7,323 | $13,433 |
| Standard Deviation (Sample) | $5,811 | $11,605 |
| Standard Deviation (Population) | $5,788 | $11,550 |
Similar Demographics by Median Female Earnings
Demographics Similar to Salvadorans by Median Female Earnings
In terms of median female earnings, the demographic groups most similar to Salvadorans are German Russian ($37,105, a difference of 0.060%), Immigrants from Belize ($37,056, a difference of 0.070%), Dominican ($37,046, a difference of 0.10%), Nonimmigrants ($37,024, a difference of 0.16%), and Cree ($37,018, a difference of 0.18%).
| Demographics | Rating | Rank | Median Female Earnings |
| Hawaiians | 1.0 /100 | #257 | Tragic $37,497 |
| Belizeans | 0.9 /100 | #258 | Tragic $37,429 |
| Scotch-Irish | 0.8 /100 | #259 | Tragic $37,383 |
| Dutch | 0.7 /100 | #260 | Tragic $37,339 |
| Malaysians | 0.7 /100 | #261 | Tragic $37,298 |
| Venezuelans | 0.7 /100 | #262 | Tragic $37,282 |
| German Russians | 0.5 /100 | #263 | Tragic $37,105 |
| Salvadorans | 0.4 /100 | #264 | Tragic $37,083 |
| Immigrants | Belize | 0.4 /100 | #265 | Tragic $37,056 |
| Dominicans | 0.4 /100 | #266 | Tragic $37,046 |
| Immigrants | Nonimmigrants | 0.4 /100 | #267 | Tragic $37,024 |
| Cree | 0.4 /100 | #268 | Tragic $37,018 |
| Immigrants | Venezuela | 0.4 /100 | #269 | Tragic $37,003 |
| French American Indians | 0.3 /100 | #270 | Tragic $36,920 |
| Nicaraguans | 0.3 /100 | #271 | Tragic $36,904 |
Demographics Similar to Indians (Asian) by Median Female Earnings
In terms of median female earnings, the demographic groups most similar to Indians (Asian) are Immigrants from Eastern Asia ($46,502, a difference of 0.050%), Soviet Union ($46,556, a difference of 0.16%), Immigrants from Australia ($46,573, a difference of 0.20%), Immigrants from South Central Asia ($46,324, a difference of 0.34%), and Okinawan ($46,905, a difference of 0.91%).
| Demographics | Rating | Rank | Median Female Earnings |
| Immigrants | Iran | 100.0 /100 | #9 | Exceptional $47,154 |
| Immigrants | China | 100.0 /100 | #10 | Exceptional $46,972 |
| Okinawans | 100.0 /100 | #11 | Exceptional $46,905 |
| Immigrants | Israel | 100.0 /100 | #12 | Exceptional $46,902 |
| Immigrants | Australia | 100.0 /100 | #13 | Exceptional $46,573 |
| Soviet Union | 100.0 /100 | #14 | Exceptional $46,556 |
| Immigrants | Eastern Asia | 100.0 /100 | #15 | Exceptional $46,502 |
| Indians (Asian) | 100.0 /100 | #16 | Exceptional $46,481 |
| Immigrants | South Central Asia | 100.0 /100 | #17 | Exceptional $46,324 |
| Cypriots | 100.0 /100 | #18 | Exceptional $45,570 |
| Eastern Europeans | 100.0 /100 | #19 | Exceptional $45,385 |
| Immigrants | Japan | 100.0 /100 | #20 | Exceptional $45,323 |
| Cambodians | 100.0 /100 | #21 | Exceptional $45,014 |
| Immigrants | Greece | 100.0 /100 | #22 | Exceptional $44,976 |
| Burmese | 100.0 /100 | #23 | Exceptional $44,911 |