Salvadoran vs Immigrants from Europe Median Female Earnings
COMPARE
Salvadoran
Immigrants from Europe
Median Female Earnings
Median Female Earnings Comparison
Salvadorans
Immigrants from Europe
$37,083
MEDIAN FEMALE EARNINGS
0.4/ 100
METRIC RATING
264th/ 347
METRIC RANK
$43,523
MEDIAN FEMALE EARNINGS
100.0/ 100
METRIC RATING
45th/ 347
METRIC RANK
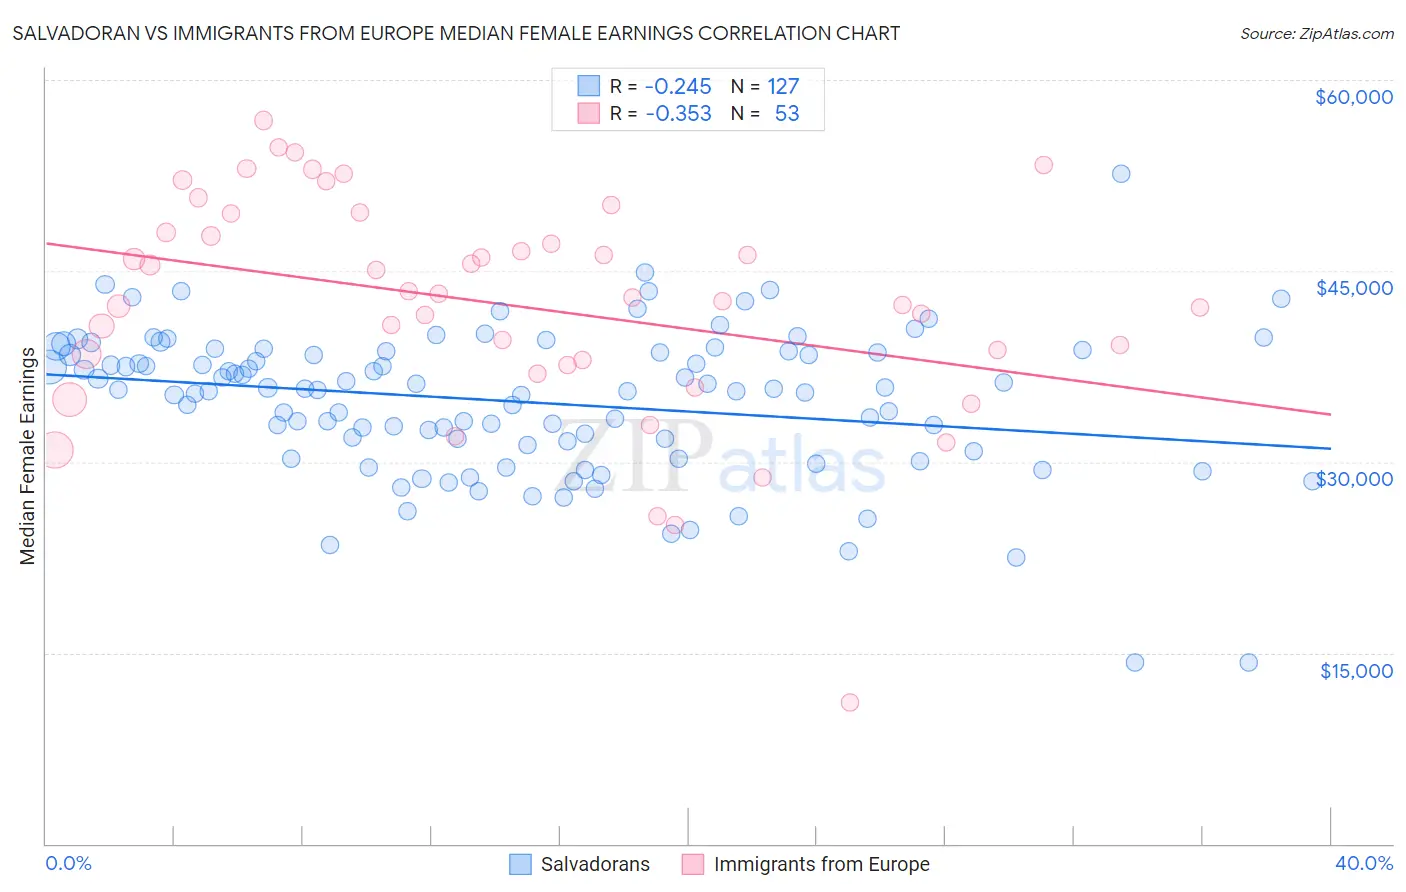
Salvadoran vs Immigrants from Europe Median Female Earnings Correlation Chart
The statistical analysis conducted on geographies consisting of 398,898,517 people shows a weak negative correlation between the proportion of Salvadorans and median female earnings in the United States with a correlation coefficient (R) of -0.245 and weighted average of $37,083. Similarly, the statistical analysis conducted on geographies consisting of 546,402,948 people shows a mild negative correlation between the proportion of Immigrants from Europe and median female earnings in the United States with a correlation coefficient (R) of -0.353 and weighted average of $43,523, a difference of 17.4%.
Median Female Earnings Correlation Summary
| Measurement | Salvadoran | Immigrants from Europe |
| Minimum | $14,245 | $11,071 |
| Maximum | $52,604 | $56,832 |
| Range | $38,359 | $45,761 |
| Mean | $34,711 | $42,400 |
| Median | $35,673 | $42,947 |
| Interquartile 25% (IQ1) | $31,372 | $37,781 |
| Interquartile 75% (IQ3) | $38,695 | $48,760 |
| Interquartile Range (IQR) | $7,323 | $10,979 |
| Standard Deviation (Sample) | $5,811 | $8,815 |
| Standard Deviation (Population) | $5,788 | $8,731 |
Similar Demographics by Median Female Earnings
Demographics Similar to Salvadorans by Median Female Earnings
In terms of median female earnings, the demographic groups most similar to Salvadorans are German Russian ($37,105, a difference of 0.060%), Immigrants from Belize ($37,056, a difference of 0.070%), Dominican ($37,046, a difference of 0.10%), Nonimmigrants ($37,024, a difference of 0.16%), and Cree ($37,018, a difference of 0.18%).
| Demographics | Rating | Rank | Median Female Earnings |
| Hawaiians | 1.0 /100 | #257 | Tragic $37,497 |
| Belizeans | 0.9 /100 | #258 | Tragic $37,429 |
| Scotch-Irish | 0.8 /100 | #259 | Tragic $37,383 |
| Dutch | 0.7 /100 | #260 | Tragic $37,339 |
| Malaysians | 0.7 /100 | #261 | Tragic $37,298 |
| Venezuelans | 0.7 /100 | #262 | Tragic $37,282 |
| German Russians | 0.5 /100 | #263 | Tragic $37,105 |
| Salvadorans | 0.4 /100 | #264 | Tragic $37,083 |
| Immigrants | Belize | 0.4 /100 | #265 | Tragic $37,056 |
| Dominicans | 0.4 /100 | #266 | Tragic $37,046 |
| Immigrants | Nonimmigrants | 0.4 /100 | #267 | Tragic $37,024 |
| Cree | 0.4 /100 | #268 | Tragic $37,018 |
| Immigrants | Venezuela | 0.4 /100 | #269 | Tragic $37,003 |
| French American Indians | 0.3 /100 | #270 | Tragic $36,920 |
| Nicaraguans | 0.3 /100 | #271 | Tragic $36,904 |
Demographics Similar to Immigrants from Europe by Median Female Earnings
In terms of median female earnings, the demographic groups most similar to Immigrants from Europe are Immigrants from Czechoslovakia ($43,571, a difference of 0.11%), Immigrants from Bolivia ($43,467, a difference of 0.13%), Bolivian ($43,445, a difference of 0.18%), Bulgarian ($43,638, a difference of 0.26%), and Immigrants from Indonesia ($43,412, a difference of 0.26%).
| Demographics | Rating | Rank | Median Female Earnings |
| Latvians | 100.0 /100 | #38 | Exceptional $43,941 |
| Israelis | 100.0 /100 | #39 | Exceptional $43,852 |
| Immigrants | Malaysia | 100.0 /100 | #40 | Exceptional $43,835 |
| Bhutanese | 100.0 /100 | #41 | Exceptional $43,648 |
| Immigrants | Denmark | 100.0 /100 | #42 | Exceptional $43,646 |
| Bulgarians | 100.0 /100 | #43 | Exceptional $43,638 |
| Immigrants | Czechoslovakia | 100.0 /100 | #44 | Exceptional $43,571 |
| Immigrants | Europe | 100.0 /100 | #45 | Exceptional $43,523 |
| Immigrants | Bolivia | 100.0 /100 | #46 | Exceptional $43,467 |
| Bolivians | 100.0 /100 | #47 | Exceptional $43,445 |
| Immigrants | Indonesia | 100.0 /100 | #48 | Exceptional $43,412 |
| Immigrants | Serbia | 100.0 /100 | #49 | Exceptional $43,385 |
| Immigrants | Uzbekistan | 100.0 /100 | #50 | Exceptional $43,363 |
| Maltese | 100.0 /100 | #51 | Exceptional $43,357 |
| Immigrants | Lithuania | 99.9 /100 | #52 | Exceptional $43,317 |