Salvadoran vs Immigrants from Panama Median Female Earnings
COMPARE
Salvadoran
Immigrants from Panama
Median Female Earnings
Median Female Earnings Comparison
Salvadorans
Immigrants from Panama
$37,083
MEDIAN FEMALE EARNINGS
0.4/ 100
METRIC RATING
264th/ 347
METRIC RANK
$39,049
MEDIAN FEMALE EARNINGS
20.6/ 100
METRIC RATING
200th/ 347
METRIC RANK
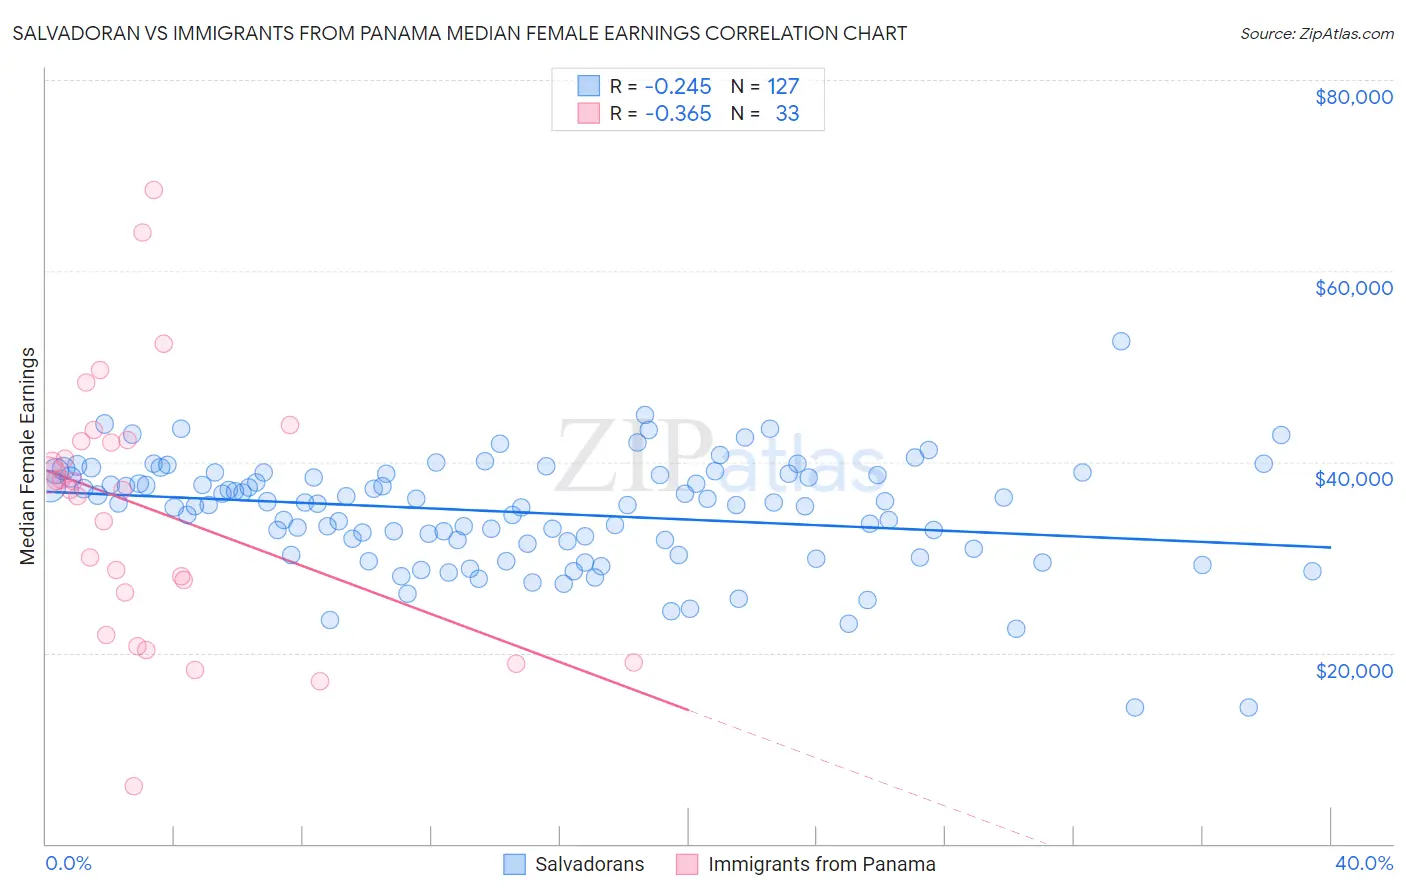
Salvadoran vs Immigrants from Panama Median Female Earnings Correlation Chart
The statistical analysis conducted on geographies consisting of 398,898,517 people shows a weak negative correlation between the proportion of Salvadorans and median female earnings in the United States with a correlation coefficient (R) of -0.245 and weighted average of $37,083. Similarly, the statistical analysis conducted on geographies consisting of 221,152,407 people shows a mild negative correlation between the proportion of Immigrants from Panama and median female earnings in the United States with a correlation coefficient (R) of -0.365 and weighted average of $39,049, a difference of 5.3%.
Median Female Earnings Correlation Summary
| Measurement | Salvadoran | Immigrants from Panama |
| Minimum | $14,245 | $6,075 |
| Maximum | $52,604 | $68,458 |
| Range | $38,359 | $62,383 |
| Mean | $34,711 | $35,051 |
| Median | $35,673 | $37,083 |
| Interquartile 25% (IQ1) | $31,372 | $24,068 |
| Interquartile 75% (IQ3) | $38,695 | $42,241 |
| Interquartile Range (IQR) | $7,323 | $18,172 |
| Standard Deviation (Sample) | $5,811 | $13,535 |
| Standard Deviation (Population) | $5,788 | $13,329 |
Similar Demographics by Median Female Earnings
Demographics Similar to Salvadorans by Median Female Earnings
In terms of median female earnings, the demographic groups most similar to Salvadorans are German Russian ($37,105, a difference of 0.060%), Immigrants from Belize ($37,056, a difference of 0.070%), Dominican ($37,046, a difference of 0.10%), Nonimmigrants ($37,024, a difference of 0.16%), and Cree ($37,018, a difference of 0.18%).
| Demographics | Rating | Rank | Median Female Earnings |
| Hawaiians | 1.0 /100 | #257 | Tragic $37,497 |
| Belizeans | 0.9 /100 | #258 | Tragic $37,429 |
| Scotch-Irish | 0.8 /100 | #259 | Tragic $37,383 |
| Dutch | 0.7 /100 | #260 | Tragic $37,339 |
| Malaysians | 0.7 /100 | #261 | Tragic $37,298 |
| Venezuelans | 0.7 /100 | #262 | Tragic $37,282 |
| German Russians | 0.5 /100 | #263 | Tragic $37,105 |
| Salvadorans | 0.4 /100 | #264 | Tragic $37,083 |
| Immigrants | Belize | 0.4 /100 | #265 | Tragic $37,056 |
| Dominicans | 0.4 /100 | #266 | Tragic $37,046 |
| Immigrants | Nonimmigrants | 0.4 /100 | #267 | Tragic $37,024 |
| Cree | 0.4 /100 | #268 | Tragic $37,018 |
| Immigrants | Venezuela | 0.4 /100 | #269 | Tragic $37,003 |
| French American Indians | 0.3 /100 | #270 | Tragic $36,920 |
| Nicaraguans | 0.3 /100 | #271 | Tragic $36,904 |
Demographics Similar to Immigrants from Panama by Median Female Earnings
In terms of median female earnings, the demographic groups most similar to Immigrants from Panama are Panamanian ($39,049, a difference of 0.0%), Slovak ($39,029, a difference of 0.050%), Icelander ($39,109, a difference of 0.15%), Czech ($38,992, a difference of 0.15%), and Ecuadorian ($39,117, a difference of 0.17%).
| Demographics | Rating | Rank | Median Female Earnings |
| Immigrants | Nigeria | 30.2 /100 | #193 | Fair $39,294 |
| Irish | 30.0 /100 | #194 | Fair $39,291 |
| Uruguayans | 27.3 /100 | #195 | Fair $39,228 |
| Immigrants | Costa Rica | 25.6 /100 | #196 | Fair $39,186 |
| Assyrians/Chaldeans/Syriacs | 24.6 /100 | #197 | Fair $39,159 |
| Ecuadorians | 23.0 /100 | #198 | Fair $39,117 |
| Icelanders | 22.7 /100 | #199 | Fair $39,109 |
| Immigrants | Panama | 20.6 /100 | #200 | Fair $39,049 |
| Panamanians | 20.6 /100 | #201 | Fair $39,049 |
| Slovaks | 19.9 /100 | #202 | Poor $39,029 |
| Czechs | 18.7 /100 | #203 | Poor $38,992 |
| Immigrants | Uruguay | 17.3 /100 | #204 | Poor $38,945 |
| Immigrants | Colombia | 16.3 /100 | #205 | Poor $38,913 |
| Immigrants | Bosnia and Herzegovina | 15.6 /100 | #206 | Poor $38,886 |
| Immigrants | Cambodia | 14.2 /100 | #207 | Poor $38,833 |