Russian vs Immigrants from Belgium Median Earnings
COMPARE
Russian
Immigrants from Belgium
Median Earnings
Median Earnings Comparison
Russians
Immigrants from Belgium
$53,334
MEDIAN EARNINGS
100.0/ 100
METRIC RATING
31st/ 347
METRIC RANK
$54,679
MEDIAN EARNINGS
100.0/ 100
METRIC RATING
19th/ 347
METRIC RANK
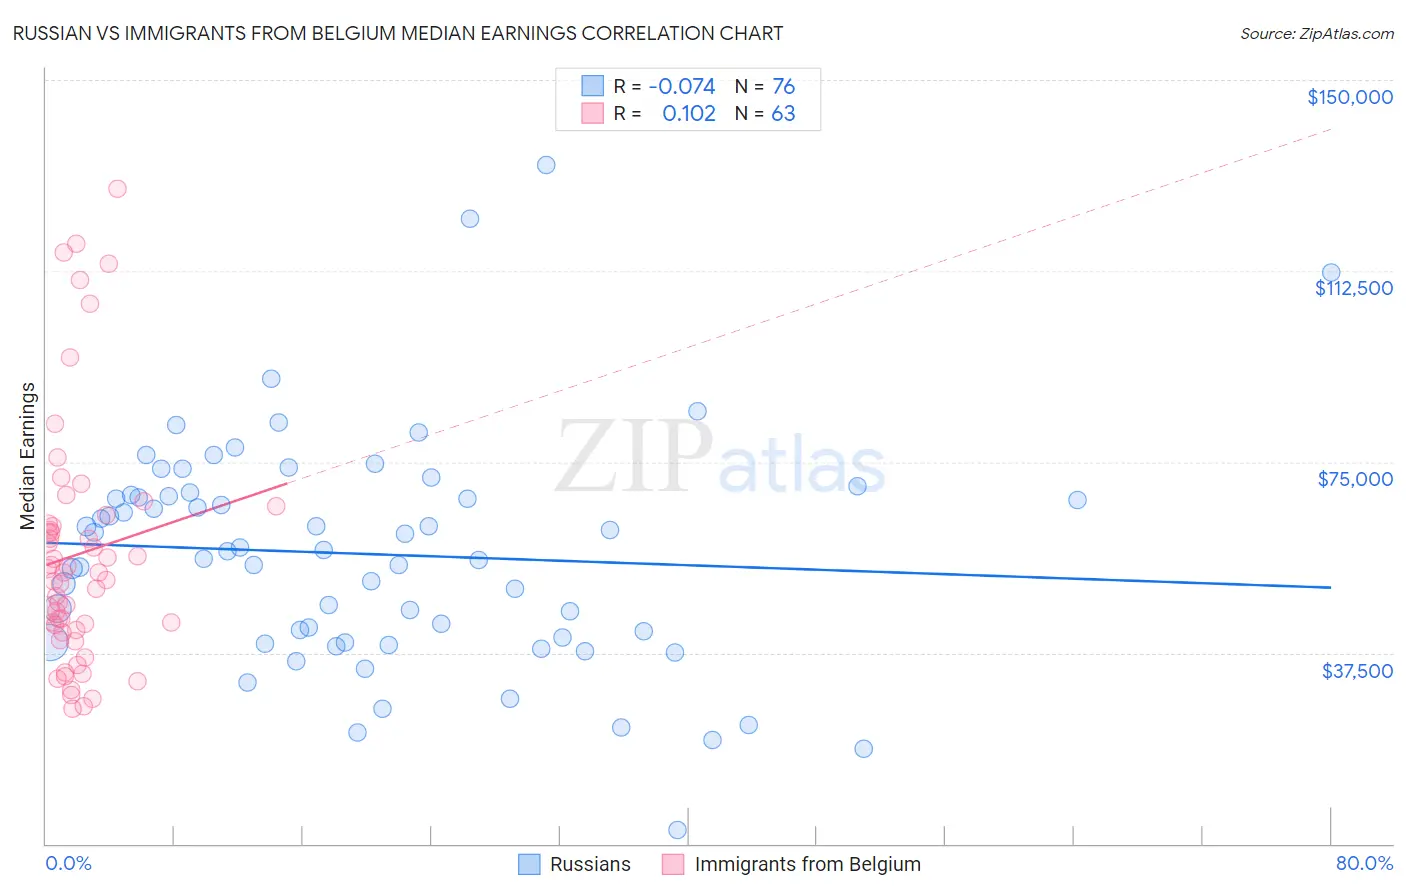
Russian vs Immigrants from Belgium Median Earnings Correlation Chart
The statistical analysis conducted on geographies consisting of 512,155,619 people shows a slight negative correlation between the proportion of Russians and median earnings in the United States with a correlation coefficient (R) of -0.074 and weighted average of $53,334. Similarly, the statistical analysis conducted on geographies consisting of 146,713,420 people shows a poor positive correlation between the proportion of Immigrants from Belgium and median earnings in the United States with a correlation coefficient (R) of 0.102 and weighted average of $54,679, a difference of 2.5%.
Median Earnings Correlation Summary
| Measurement | Russian | Immigrants from Belgium |
| Minimum | $2,766 | $26,625 |
| Maximum | $133,235 | $128,750 |
| Range | $130,469 | $102,125 |
| Mean | $56,899 | $56,854 |
| Median | $57,547 | $53,265 |
| Interquartile 25% (IQ1) | $40,132 | $41,924 |
| Interquartile 75% (IQ3) | $68,448 | $62,836 |
| Interquartile Range (IQR) | $28,315 | $20,912 |
| Standard Deviation (Sample) | $22,580 | $23,786 |
| Standard Deviation (Population) | $22,431 | $23,597 |
Demographics Similar to Russians and Immigrants from Belgium by Median Earnings
In terms of median earnings, the demographic groups most similar to Russians are Immigrants from Asia ($53,310, a difference of 0.040%), Cambodian ($53,386, a difference of 0.10%), Immigrants from Greece ($53,282, a difference of 0.10%), Immigrants from Sri Lanka ($53,268, a difference of 0.12%), and Immigrants from Russia ($53,457, a difference of 0.23%). Similarly, the demographic groups most similar to Immigrants from Belgium are Cypriot ($54,589, a difference of 0.16%), Burmese ($54,559, a difference of 0.22%), Immigrants from Korea ($54,530, a difference of 0.27%), Immigrants from Sweden ($54,478, a difference of 0.37%), and Immigrants from Japan ($54,938, a difference of 0.47%).
| Demographics | Rating | Rank | Median Earnings |
| Indians (Asian) | 100.0 /100 | #15 | Exceptional $56,253 |
| Immigrants | Eastern Asia | 100.0 /100 | #16 | Exceptional $56,183 |
| Eastern Europeans | 100.0 /100 | #17 | Exceptional $55,084 |
| Immigrants | Japan | 100.0 /100 | #18 | Exceptional $54,938 |
| Immigrants | Belgium | 100.0 /100 | #19 | Exceptional $54,679 |
| Cypriots | 100.0 /100 | #20 | Exceptional $54,589 |
| Burmese | 100.0 /100 | #21 | Exceptional $54,559 |
| Immigrants | Korea | 100.0 /100 | #22 | Exceptional $54,530 |
| Immigrants | Sweden | 100.0 /100 | #23 | Exceptional $54,478 |
| Soviet Union | 100.0 /100 | #24 | Exceptional $54,290 |
| Turks | 100.0 /100 | #25 | Exceptional $53,919 |
| Immigrants | Northern Europe | 100.0 /100 | #26 | Exceptional $53,872 |
| Asians | 100.0 /100 | #27 | Exceptional $53,690 |
| Immigrants | France | 100.0 /100 | #28 | Exceptional $53,490 |
| Immigrants | Russia | 100.0 /100 | #29 | Exceptional $53,457 |
| Cambodians | 100.0 /100 | #30 | Exceptional $53,386 |
| Russians | 100.0 /100 | #31 | Exceptional $53,334 |
| Immigrants | Asia | 100.0 /100 | #32 | Exceptional $53,310 |
| Immigrants | Greece | 100.0 /100 | #33 | Exceptional $53,282 |
| Immigrants | Sri Lanka | 100.0 /100 | #34 | Exceptional $53,268 |
| Immigrants | Switzerland | 100.0 /100 | #35 | Exceptional $53,211 |