Russian vs Immigrants from Kenya Median Earnings
COMPARE
Russian
Immigrants from Kenya
Median Earnings
Median Earnings Comparison
Russians
Immigrants from Kenya
$53,334
MEDIAN EARNINGS
100.0/ 100
METRIC RATING
31st/ 347
METRIC RANK
$46,214
MEDIAN EARNINGS
42.4/ 100
METRIC RATING
184th/ 347
METRIC RANK
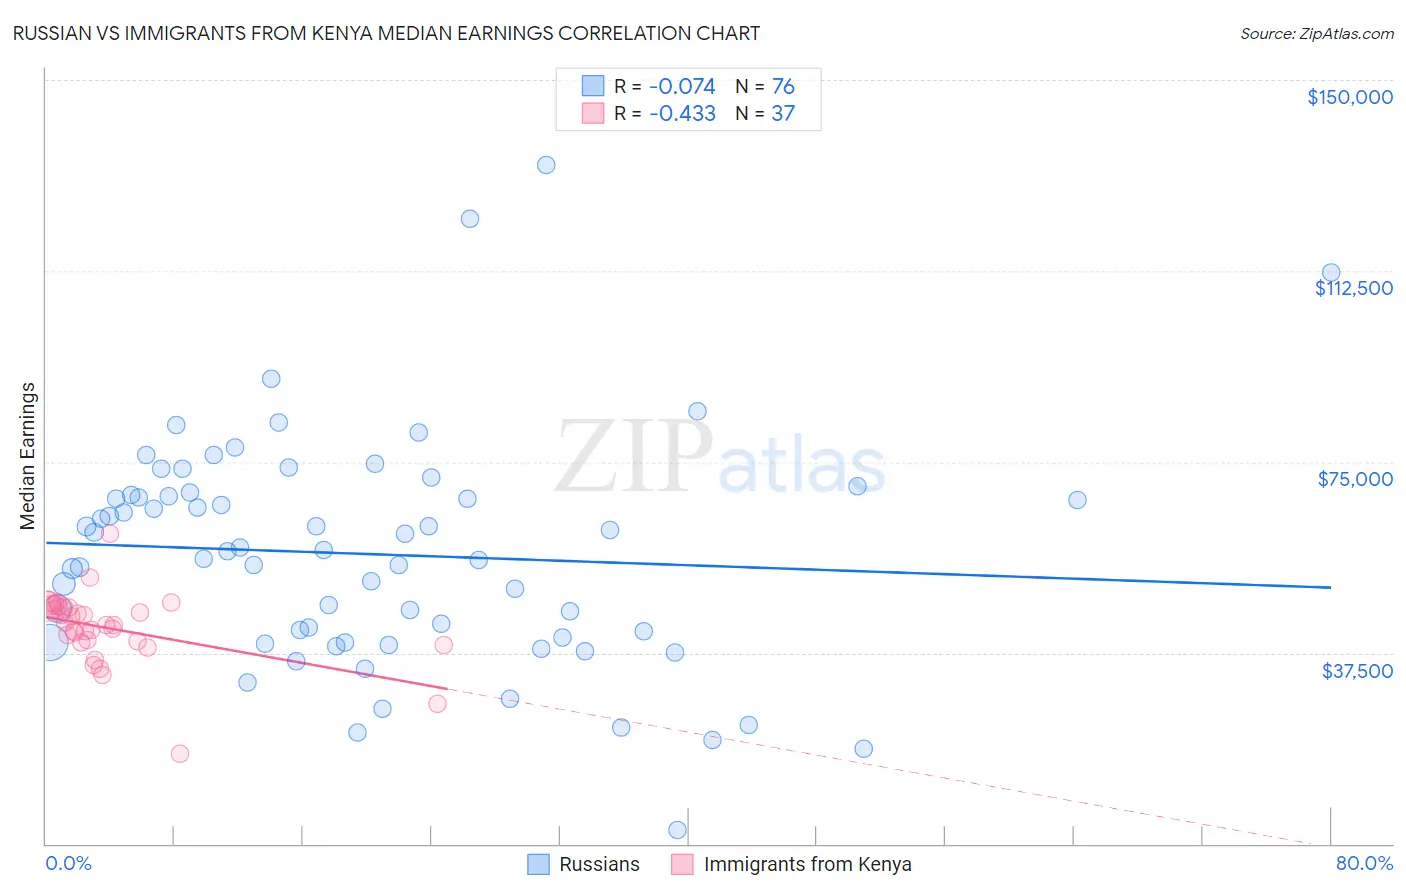
Russian vs Immigrants from Kenya Median Earnings Correlation Chart
The statistical analysis conducted on geographies consisting of 512,155,619 people shows a slight negative correlation between the proportion of Russians and median earnings in the United States with a correlation coefficient (R) of -0.074 and weighted average of $53,334. Similarly, the statistical analysis conducted on geographies consisting of 218,063,953 people shows a moderate negative correlation between the proportion of Immigrants from Kenya and median earnings in the United States with a correlation coefficient (R) of -0.433 and weighted average of $46,214, a difference of 15.4%.
Median Earnings Correlation Summary
| Measurement | Russian | Immigrants from Kenya |
| Minimum | $2,766 | $17,794 |
| Maximum | $133,235 | $60,938 |
| Range | $130,469 | $43,144 |
| Mean | $56,899 | $42,338 |
| Median | $57,547 | $42,995 |
| Interquartile 25% (IQ1) | $40,132 | $39,646 |
| Interquartile 75% (IQ3) | $68,448 | $46,440 |
| Interquartile Range (IQR) | $28,315 | $6,794 |
| Standard Deviation (Sample) | $22,580 | $7,069 |
| Standard Deviation (Population) | $22,431 | $6,973 |
Similar Demographics by Median Earnings
Demographics Similar to Russians by Median Earnings
In terms of median earnings, the demographic groups most similar to Russians are Immigrants from Asia ($53,310, a difference of 0.040%), Cambodian ($53,386, a difference of 0.10%), Immigrants from Greece ($53,282, a difference of 0.10%), Immigrants from Sri Lanka ($53,268, a difference of 0.12%), and Immigrants from Russia ($53,457, a difference of 0.23%).
| Demographics | Rating | Rank | Median Earnings |
| Soviet Union | 100.0 /100 | #24 | Exceptional $54,290 |
| Turks | 100.0 /100 | #25 | Exceptional $53,919 |
| Immigrants | Northern Europe | 100.0 /100 | #26 | Exceptional $53,872 |
| Asians | 100.0 /100 | #27 | Exceptional $53,690 |
| Immigrants | France | 100.0 /100 | #28 | Exceptional $53,490 |
| Immigrants | Russia | 100.0 /100 | #29 | Exceptional $53,457 |
| Cambodians | 100.0 /100 | #30 | Exceptional $53,386 |
| Russians | 100.0 /100 | #31 | Exceptional $53,334 |
| Immigrants | Asia | 100.0 /100 | #32 | Exceptional $53,310 |
| Immigrants | Greece | 100.0 /100 | #33 | Exceptional $53,282 |
| Immigrants | Sri Lanka | 100.0 /100 | #34 | Exceptional $53,268 |
| Immigrants | Switzerland | 100.0 /100 | #35 | Exceptional $53,211 |
| Immigrants | Denmark | 100.0 /100 | #36 | Exceptional $53,186 |
| Immigrants | Belarus | 100.0 /100 | #37 | Exceptional $53,043 |
| Latvians | 100.0 /100 | #38 | Exceptional $53,001 |
Demographics Similar to Immigrants from Kenya by Median Earnings
In terms of median earnings, the demographic groups most similar to Immigrants from Kenya are Uruguayan ($46,190, a difference of 0.050%), Vietnamese ($46,172, a difference of 0.090%), Iraqi ($46,140, a difference of 0.16%), French ($46,296, a difference of 0.18%), and Swiss ($46,315, a difference of 0.22%).
| Demographics | Rating | Rank | Median Earnings |
| Belgians | 48.0 /100 | #177 | Average $46,375 |
| Colombians | 47.1 /100 | #178 | Average $46,349 |
| English | 46.5 /100 | #179 | Average $46,334 |
| Puget Sound Salish | 46.5 /100 | #180 | Average $46,333 |
| Immigrants | Cameroon | 46.4 /100 | #181 | Average $46,329 |
| Swiss | 45.9 /100 | #182 | Average $46,315 |
| French | 45.2 /100 | #183 | Average $46,296 |
| Immigrants | Kenya | 42.4 /100 | #184 | Average $46,214 |
| Uruguayans | 41.6 /100 | #185 | Average $46,190 |
| Vietnamese | 40.9 /100 | #186 | Average $46,172 |
| Iraqis | 39.9 /100 | #187 | Fair $46,140 |
| Immigrants | Armenia | 38.3 /100 | #188 | Fair $46,094 |
| Spaniards | 37.2 /100 | #189 | Fair $46,059 |
| French Canadians | 36.1 /100 | #190 | Fair $46,026 |
| Finns | 33.4 /100 | #191 | Fair $45,940 |