Immigrants from Denmark vs Immigrants from Belgium Median Earnings
COMPARE
Immigrants from Denmark
Immigrants from Belgium
Median Earnings
Median Earnings Comparison
Immigrants from Denmark
Immigrants from Belgium
$53,186
MEDIAN EARNINGS
100.0/ 100
METRIC RATING
36th/ 347
METRIC RANK
$54,679
MEDIAN EARNINGS
100.0/ 100
METRIC RATING
19th/ 347
METRIC RANK
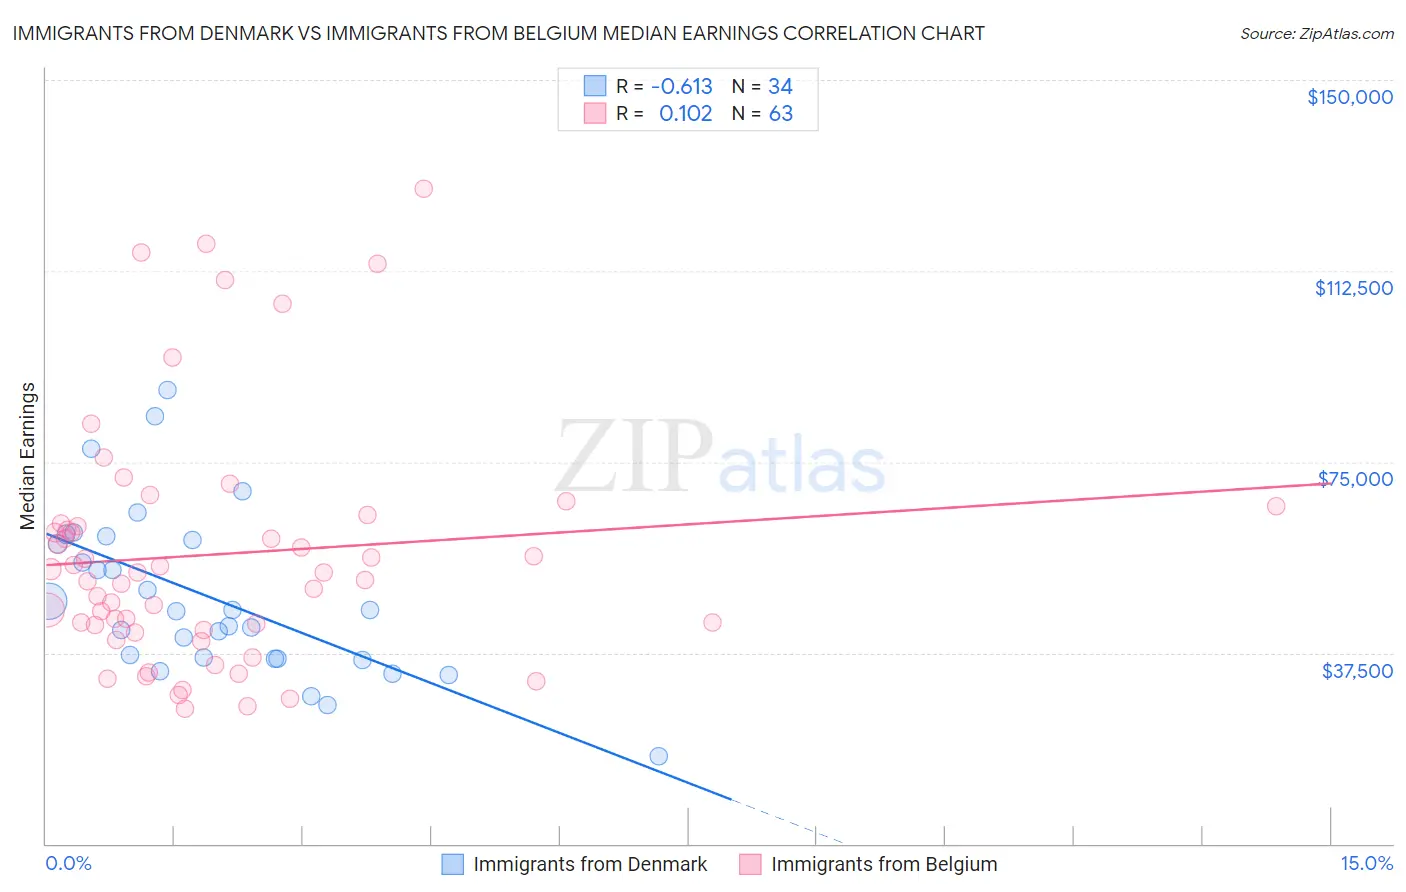
Immigrants from Denmark vs Immigrants from Belgium Median Earnings Correlation Chart
The statistical analysis conducted on geographies consisting of 136,423,232 people shows a significant negative correlation between the proportion of Immigrants from Denmark and median earnings in the United States with a correlation coefficient (R) of -0.613 and weighted average of $53,186. Similarly, the statistical analysis conducted on geographies consisting of 146,713,420 people shows a poor positive correlation between the proportion of Immigrants from Belgium and median earnings in the United States with a correlation coefficient (R) of 0.102 and weighted average of $54,679, a difference of 2.8%.
Median Earnings Correlation Summary
| Measurement | Immigrants from Denmark | Immigrants from Belgium |
| Minimum | $17,222 | $26,625 |
| Maximum | $89,094 | $128,750 |
| Range | $71,872 | $102,125 |
| Mean | $48,495 | $56,854 |
| Median | $45,741 | $53,265 |
| Interquartile 25% (IQ1) | $36,425 | $41,924 |
| Interquartile 75% (IQ3) | $59,711 | $62,836 |
| Interquartile Range (IQR) | $23,286 | $20,912 |
| Standard Deviation (Sample) | $16,233 | $23,786 |
| Standard Deviation (Population) | $15,992 | $23,597 |
Demographics Similar to Immigrants from Denmark and Immigrants from Belgium by Median Earnings
In terms of median earnings, the demographic groups most similar to Immigrants from Denmark are Immigrants from Switzerland ($53,211, a difference of 0.050%), Immigrants from Sri Lanka ($53,268, a difference of 0.15%), Immigrants from Greece ($53,282, a difference of 0.18%), Immigrants from Asia ($53,310, a difference of 0.23%), and Immigrants from Belarus ($53,043, a difference of 0.27%). Similarly, the demographic groups most similar to Immigrants from Belgium are Cypriot ($54,589, a difference of 0.16%), Burmese ($54,559, a difference of 0.22%), Immigrants from Korea ($54,530, a difference of 0.27%), Immigrants from Sweden ($54,478, a difference of 0.37%), and Immigrants from Japan ($54,938, a difference of 0.47%).
| Demographics | Rating | Rank | Median Earnings |
| Eastern Europeans | 100.0 /100 | #17 | Exceptional $55,084 |
| Immigrants | Japan | 100.0 /100 | #18 | Exceptional $54,938 |
| Immigrants | Belgium | 100.0 /100 | #19 | Exceptional $54,679 |
| Cypriots | 100.0 /100 | #20 | Exceptional $54,589 |
| Burmese | 100.0 /100 | #21 | Exceptional $54,559 |
| Immigrants | Korea | 100.0 /100 | #22 | Exceptional $54,530 |
| Immigrants | Sweden | 100.0 /100 | #23 | Exceptional $54,478 |
| Soviet Union | 100.0 /100 | #24 | Exceptional $54,290 |
| Turks | 100.0 /100 | #25 | Exceptional $53,919 |
| Immigrants | Northern Europe | 100.0 /100 | #26 | Exceptional $53,872 |
| Asians | 100.0 /100 | #27 | Exceptional $53,690 |
| Immigrants | France | 100.0 /100 | #28 | Exceptional $53,490 |
| Immigrants | Russia | 100.0 /100 | #29 | Exceptional $53,457 |
| Cambodians | 100.0 /100 | #30 | Exceptional $53,386 |
| Russians | 100.0 /100 | #31 | Exceptional $53,334 |
| Immigrants | Asia | 100.0 /100 | #32 | Exceptional $53,310 |
| Immigrants | Greece | 100.0 /100 | #33 | Exceptional $53,282 |
| Immigrants | Sri Lanka | 100.0 /100 | #34 | Exceptional $53,268 |
| Immigrants | Switzerland | 100.0 /100 | #35 | Exceptional $53,211 |
| Immigrants | Denmark | 100.0 /100 | #36 | Exceptional $53,186 |
| Immigrants | Belarus | 100.0 /100 | #37 | Exceptional $53,043 |