Russian vs Alsatian Median Earnings
COMPARE
Russian
Alsatian
Median Earnings
Median Earnings Comparison
Russians
Alsatians
$53,334
MEDIAN EARNINGS
100.0/ 100
METRIC RATING
31st/ 347
METRIC RANK
$47,023
MEDIAN EARNINGS
69.6/ 100
METRIC RATING
160th/ 347
METRIC RANK
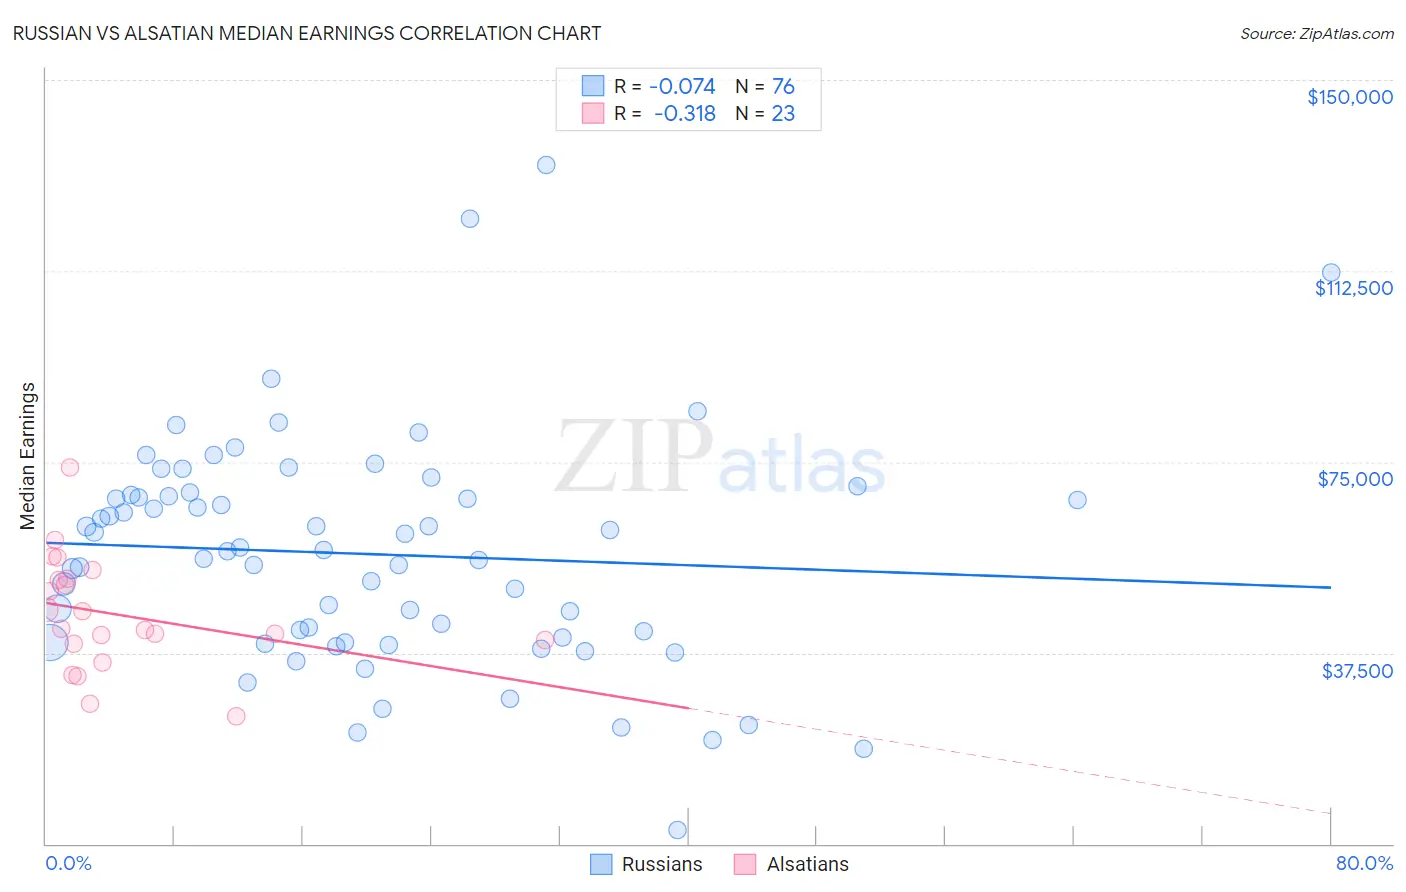
Russian vs Alsatian Median Earnings Correlation Chart
The statistical analysis conducted on geographies consisting of 512,155,619 people shows a slight negative correlation between the proportion of Russians and median earnings in the United States with a correlation coefficient (R) of -0.074 and weighted average of $53,334. Similarly, the statistical analysis conducted on geographies consisting of 82,677,221 people shows a mild negative correlation between the proportion of Alsatians and median earnings in the United States with a correlation coefficient (R) of -0.318 and weighted average of $47,023, a difference of 13.4%.
Median Earnings Correlation Summary
| Measurement | Russian | Alsatian |
| Minimum | $2,766 | $25,064 |
| Maximum | $133,235 | $73,935 |
| Range | $130,469 | $48,871 |
| Mean | $56,899 | $45,093 |
| Median | $57,547 | $42,188 |
| Interquartile 25% (IQ1) | $40,132 | $39,345 |
| Interquartile 75% (IQ3) | $68,448 | $52,137 |
| Interquartile Range (IQR) | $28,315 | $12,792 |
| Standard Deviation (Sample) | $22,580 | $11,160 |
| Standard Deviation (Population) | $22,431 | $10,915 |
Similar Demographics by Median Earnings
Demographics Similar to Russians by Median Earnings
In terms of median earnings, the demographic groups most similar to Russians are Immigrants from Asia ($53,310, a difference of 0.040%), Cambodian ($53,386, a difference of 0.10%), Immigrants from Greece ($53,282, a difference of 0.10%), Immigrants from Sri Lanka ($53,268, a difference of 0.12%), and Immigrants from Russia ($53,457, a difference of 0.23%).
| Demographics | Rating | Rank | Median Earnings |
| Soviet Union | 100.0 /100 | #24 | Exceptional $54,290 |
| Turks | 100.0 /100 | #25 | Exceptional $53,919 |
| Immigrants | Northern Europe | 100.0 /100 | #26 | Exceptional $53,872 |
| Asians | 100.0 /100 | #27 | Exceptional $53,690 |
| Immigrants | France | 100.0 /100 | #28 | Exceptional $53,490 |
| Immigrants | Russia | 100.0 /100 | #29 | Exceptional $53,457 |
| Cambodians | 100.0 /100 | #30 | Exceptional $53,386 |
| Russians | 100.0 /100 | #31 | Exceptional $53,334 |
| Immigrants | Asia | 100.0 /100 | #32 | Exceptional $53,310 |
| Immigrants | Greece | 100.0 /100 | #33 | Exceptional $53,282 |
| Immigrants | Sri Lanka | 100.0 /100 | #34 | Exceptional $53,268 |
| Immigrants | Switzerland | 100.0 /100 | #35 | Exceptional $53,211 |
| Immigrants | Denmark | 100.0 /100 | #36 | Exceptional $53,186 |
| Immigrants | Belarus | 100.0 /100 | #37 | Exceptional $53,043 |
| Latvians | 100.0 /100 | #38 | Exceptional $53,001 |
Demographics Similar to Alsatians by Median Earnings
In terms of median earnings, the demographic groups most similar to Alsatians are Immigrants from Peru ($47,025, a difference of 0.0%), Immigrants from Eastern Africa ($46,969, a difference of 0.11%), Slovak ($47,095, a difference of 0.15%), South American Indian ($46,952, a difference of 0.15%), and Icelander ($46,916, a difference of 0.23%).
| Demographics | Rating | Rank | Median Earnings |
| Slavs | 81.1 /100 | #153 | Excellent $47,470 |
| Immigrants | Portugal | 77.3 /100 | #154 | Good $47,304 |
| Immigrants | Vietnam | 76.7 /100 | #155 | Good $47,282 |
| Irish | 76.6 /100 | #156 | Good $47,276 |
| Czechs | 75.1 /100 | #157 | Good $47,221 |
| Slovaks | 71.7 /100 | #158 | Good $47,095 |
| Immigrants | Peru | 69.6 /100 | #159 | Good $47,025 |
| Alsatians | 69.6 /100 | #160 | Good $47,023 |
| Immigrants | Eastern Africa | 68.0 /100 | #161 | Good $46,969 |
| South American Indians | 67.4 /100 | #162 | Good $46,952 |
| Icelanders | 66.3 /100 | #163 | Good $46,916 |
| Norwegians | 64.7 /100 | #164 | Good $46,865 |
| South Americans | 62.7 /100 | #165 | Good $46,804 |
| Czechoslovakians | 57.8 /100 | #166 | Average $46,658 |
| Costa Ricans | 57.4 /100 | #167 | Average $46,645 |