Yugoslavian vs Immigrants from Belgium Median Earnings
COMPARE
Yugoslavian
Immigrants from Belgium
Median Earnings
Median Earnings Comparison
Yugoslavians
Immigrants from Belgium
$45,846
MEDIAN EARNINGS
30.5/ 100
METRIC RATING
196th/ 347
METRIC RANK
$54,679
MEDIAN EARNINGS
100.0/ 100
METRIC RATING
19th/ 347
METRIC RANK
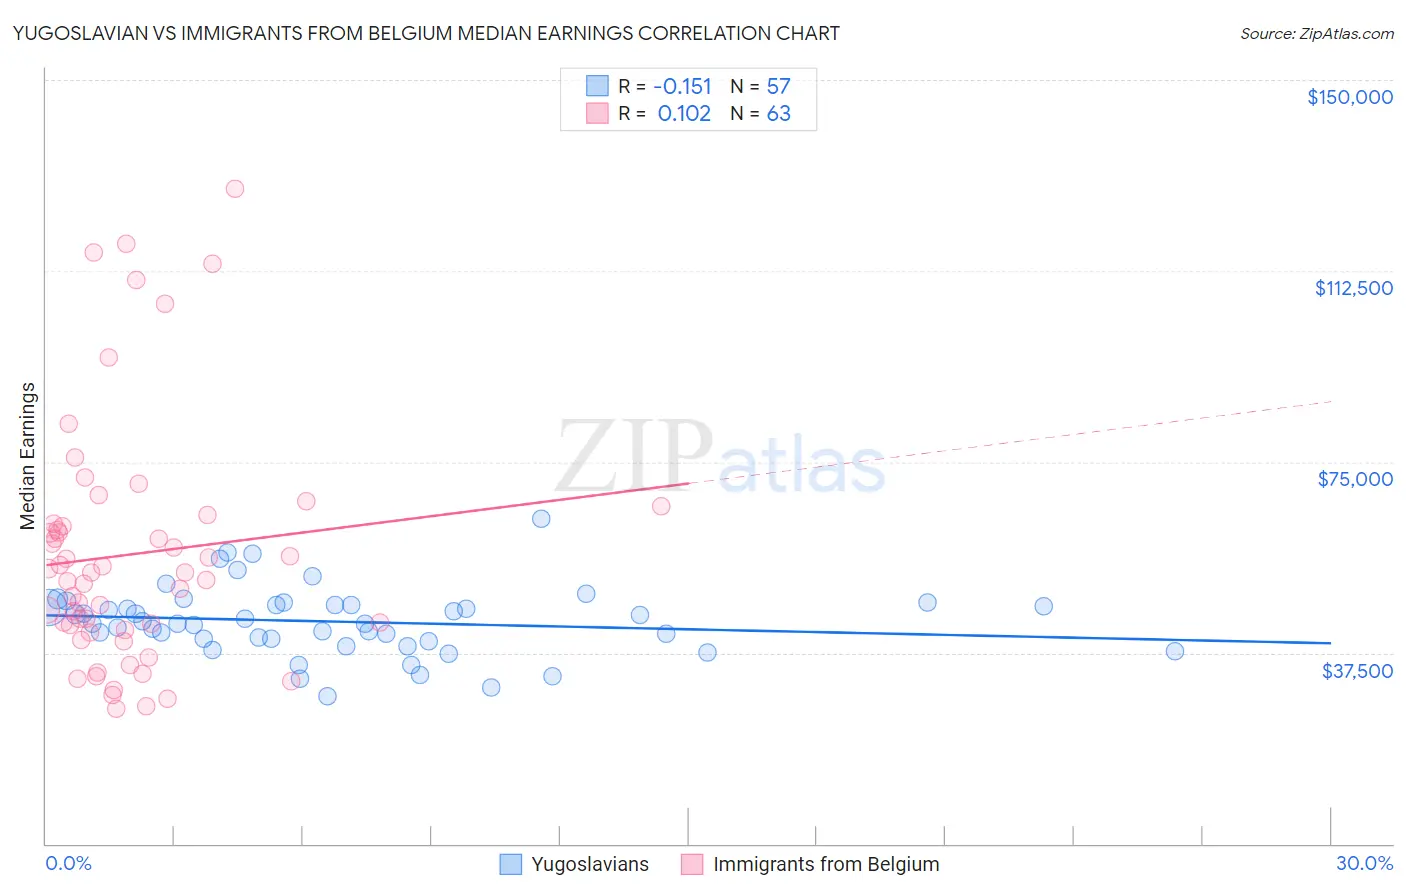
Yugoslavian vs Immigrants from Belgium Median Earnings Correlation Chart
The statistical analysis conducted on geographies consisting of 285,700,192 people shows a poor negative correlation between the proportion of Yugoslavians and median earnings in the United States with a correlation coefficient (R) of -0.151 and weighted average of $45,846. Similarly, the statistical analysis conducted on geographies consisting of 146,713,420 people shows a poor positive correlation between the proportion of Immigrants from Belgium and median earnings in the United States with a correlation coefficient (R) of 0.102 and weighted average of $54,679, a difference of 19.3%.
Median Earnings Correlation Summary
| Measurement | Yugoslavian | Immigrants from Belgium |
| Minimum | $29,039 | $26,625 |
| Maximum | $63,892 | $128,750 |
| Range | $34,853 | $102,125 |
| Mean | $43,647 | $56,854 |
| Median | $43,187 | $53,265 |
| Interquartile 25% (IQ1) | $39,984 | $41,924 |
| Interquartile 75% (IQ3) | $46,857 | $62,836 |
| Interquartile Range (IQR) | $6,873 | $20,912 |
| Standard Deviation (Sample) | $6,694 | $23,786 |
| Standard Deviation (Population) | $6,635 | $23,597 |
Similar Demographics by Median Earnings
Demographics Similar to Yugoslavians by Median Earnings
In terms of median earnings, the demographic groups most similar to Yugoslavians are Barbadian ($45,846, a difference of 0.0%), Trinidadian and Tobagonian ($45,820, a difference of 0.060%), Immigrants from Barbados ($45,816, a difference of 0.070%), Immigrants from the Azores ($45,812, a difference of 0.070%), and Immigrants from St. Vincent and the Grenadines ($45,908, a difference of 0.13%).
| Demographics | Rating | Rank | Median Earnings |
| Spaniards | 37.2 /100 | #189 | Fair $46,059 |
| French Canadians | 36.1 /100 | #190 | Fair $46,026 |
| Finns | 33.4 /100 | #191 | Fair $45,940 |
| Germans | 33.2 /100 | #192 | Fair $45,935 |
| Guamanians/Chamorros | 33.2 /100 | #193 | Fair $45,933 |
| Immigrants | Costa Rica | 33.0 /100 | #194 | Fair $45,928 |
| Immigrants | St. Vincent and the Grenadines | 32.4 /100 | #195 | Fair $45,908 |
| Yugoslavians | 30.5 /100 | #196 | Fair $45,846 |
| Barbadians | 30.5 /100 | #197 | Fair $45,846 |
| Trinidadians and Tobagonians | 29.7 /100 | #198 | Fair $45,820 |
| Immigrants | Barbados | 29.6 /100 | #199 | Fair $45,816 |
| Immigrants | Azores | 29.5 /100 | #200 | Fair $45,812 |
| Celtics | 27.2 /100 | #201 | Fair $45,732 |
| Immigrants | Trinidad and Tobago | 27.1 /100 | #202 | Fair $45,729 |
| Welsh | 26.6 /100 | #203 | Fair $45,710 |
Demographics Similar to Immigrants from Belgium by Median Earnings
In terms of median earnings, the demographic groups most similar to Immigrants from Belgium are Cypriot ($54,589, a difference of 0.16%), Burmese ($54,559, a difference of 0.22%), Immigrants from Korea ($54,530, a difference of 0.27%), Immigrants from Sweden ($54,478, a difference of 0.37%), and Immigrants from Japan ($54,938, a difference of 0.47%).
| Demographics | Rating | Rank | Median Earnings |
| Immigrants | Ireland | 100.0 /100 | #12 | Exceptional $56,854 |
| Immigrants | China | 100.0 /100 | #13 | Exceptional $56,638 |
| Immigrants | Australia | 100.0 /100 | #14 | Exceptional $56,305 |
| Indians (Asian) | 100.0 /100 | #15 | Exceptional $56,253 |
| Immigrants | Eastern Asia | 100.0 /100 | #16 | Exceptional $56,183 |
| Eastern Europeans | 100.0 /100 | #17 | Exceptional $55,084 |
| Immigrants | Japan | 100.0 /100 | #18 | Exceptional $54,938 |
| Immigrants | Belgium | 100.0 /100 | #19 | Exceptional $54,679 |
| Cypriots | 100.0 /100 | #20 | Exceptional $54,589 |
| Burmese | 100.0 /100 | #21 | Exceptional $54,559 |
| Immigrants | Korea | 100.0 /100 | #22 | Exceptional $54,530 |
| Immigrants | Sweden | 100.0 /100 | #23 | Exceptional $54,478 |
| Soviet Union | 100.0 /100 | #24 | Exceptional $54,290 |
| Turks | 100.0 /100 | #25 | Exceptional $53,919 |
| Immigrants | Northern Europe | 100.0 /100 | #26 | Exceptional $53,872 |