Russian vs Immigrants from Ecuador Median Earnings
COMPARE
Russian
Immigrants from Ecuador
Median Earnings
Median Earnings Comparison
Russians
Immigrants from Ecuador
$53,334
MEDIAN EARNINGS
100.0/ 100
METRIC RATING
31st/ 347
METRIC RANK
$44,462
MEDIAN EARNINGS
5.9/ 100
METRIC RATING
237th/ 347
METRIC RANK
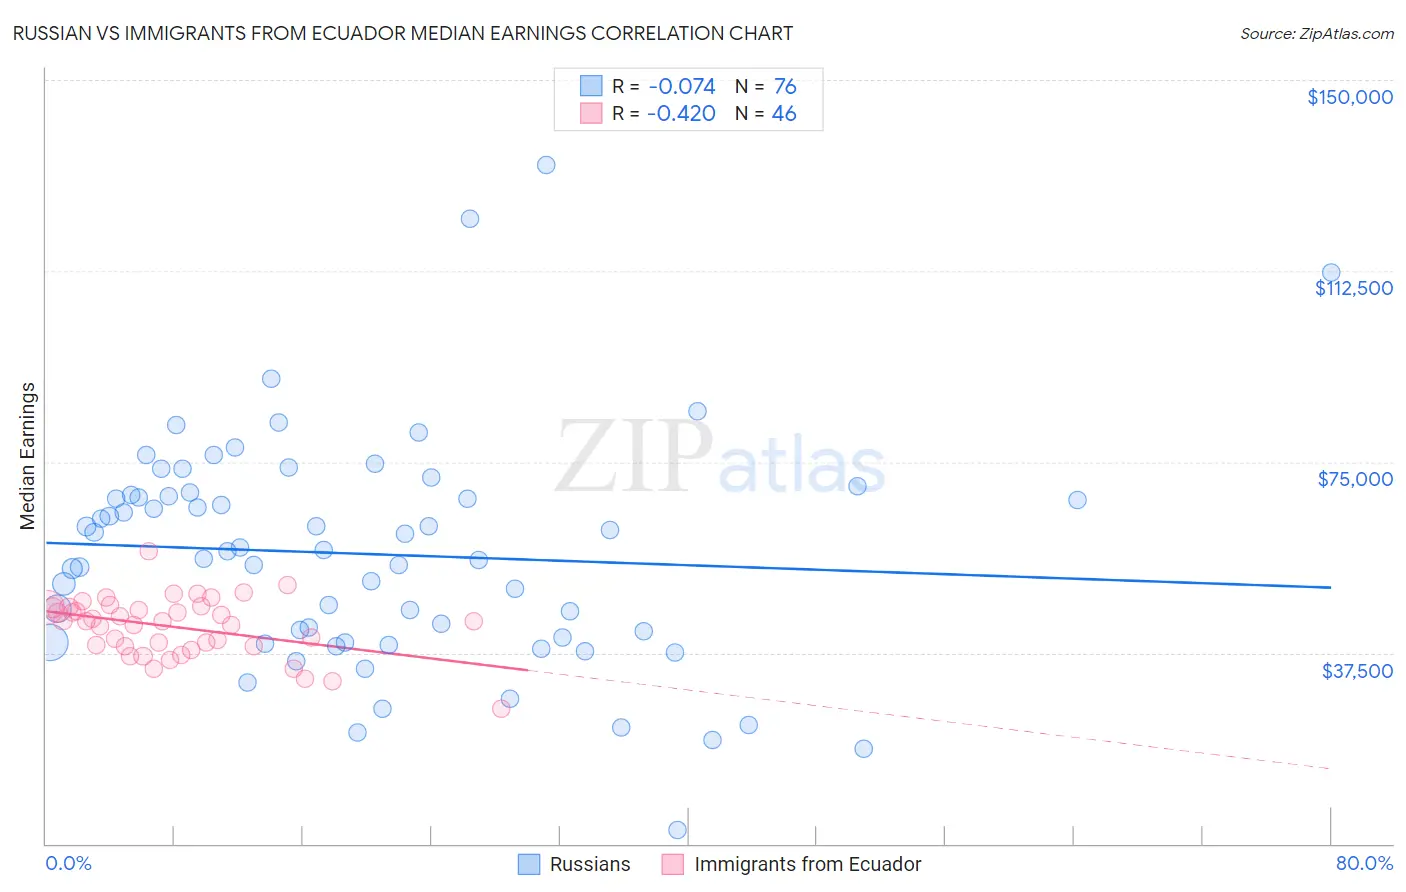
Russian vs Immigrants from Ecuador Median Earnings Correlation Chart
The statistical analysis conducted on geographies consisting of 512,155,619 people shows a slight negative correlation between the proportion of Russians and median earnings in the United States with a correlation coefficient (R) of -0.074 and weighted average of $53,334. Similarly, the statistical analysis conducted on geographies consisting of 271,003,938 people shows a moderate negative correlation between the proportion of Immigrants from Ecuador and median earnings in the United States with a correlation coefficient (R) of -0.420 and weighted average of $44,462, a difference of 20.0%.
Median Earnings Correlation Summary
| Measurement | Russian | Immigrants from Ecuador |
| Minimum | $2,766 | $26,500 |
| Maximum | $133,235 | $57,428 |
| Range | $130,469 | $30,928 |
| Mean | $56,899 | $42,586 |
| Median | $57,547 | $43,711 |
| Interquartile 25% (IQ1) | $40,132 | $38,859 |
| Interquartile 75% (IQ3) | $68,448 | $46,439 |
| Interquartile Range (IQR) | $28,315 | $7,579 |
| Standard Deviation (Sample) | $22,580 | $5,767 |
| Standard Deviation (Population) | $22,431 | $5,704 |
Similar Demographics by Median Earnings
Demographics Similar to Russians by Median Earnings
In terms of median earnings, the demographic groups most similar to Russians are Immigrants from Asia ($53,310, a difference of 0.040%), Cambodian ($53,386, a difference of 0.10%), Immigrants from Greece ($53,282, a difference of 0.10%), Immigrants from Sri Lanka ($53,268, a difference of 0.12%), and Immigrants from Russia ($53,457, a difference of 0.23%).
| Demographics | Rating | Rank | Median Earnings |
| Soviet Union | 100.0 /100 | #24 | Exceptional $54,290 |
| Turks | 100.0 /100 | #25 | Exceptional $53,919 |
| Immigrants | Northern Europe | 100.0 /100 | #26 | Exceptional $53,872 |
| Asians | 100.0 /100 | #27 | Exceptional $53,690 |
| Immigrants | France | 100.0 /100 | #28 | Exceptional $53,490 |
| Immigrants | Russia | 100.0 /100 | #29 | Exceptional $53,457 |
| Cambodians | 100.0 /100 | #30 | Exceptional $53,386 |
| Russians | 100.0 /100 | #31 | Exceptional $53,334 |
| Immigrants | Asia | 100.0 /100 | #32 | Exceptional $53,310 |
| Immigrants | Greece | 100.0 /100 | #33 | Exceptional $53,282 |
| Immigrants | Sri Lanka | 100.0 /100 | #34 | Exceptional $53,268 |
| Immigrants | Switzerland | 100.0 /100 | #35 | Exceptional $53,211 |
| Immigrants | Denmark | 100.0 /100 | #36 | Exceptional $53,186 |
| Immigrants | Belarus | 100.0 /100 | #37 | Exceptional $53,043 |
| Latvians | 100.0 /100 | #38 | Exceptional $53,001 |
Demographics Similar to Immigrants from Ecuador by Median Earnings
In terms of median earnings, the demographic groups most similar to Immigrants from Ecuador are Sudanese ($44,419, a difference of 0.10%), British West Indian ($44,552, a difference of 0.20%), Senegalese ($44,373, a difference of 0.20%), Venezuelan ($44,580, a difference of 0.27%), and Cape Verdean ($44,640, a difference of 0.40%).
| Demographics | Rating | Rank | Median Earnings |
| Immigrants | Western Africa | 10.3 /100 | #230 | Poor $44,893 |
| Japanese | 9.5 /100 | #231 | Tragic $44,825 |
| Delaware | 9.0 /100 | #232 | Tragic $44,783 |
| Immigrants | Sudan | 8.8 /100 | #233 | Tragic $44,767 |
| Cape Verdeans | 7.5 /100 | #234 | Tragic $44,640 |
| Venezuelans | 6.9 /100 | #235 | Tragic $44,580 |
| British West Indians | 6.7 /100 | #236 | Tragic $44,552 |
| Immigrants | Ecuador | 5.9 /100 | #237 | Tragic $44,462 |
| Sudanese | 5.6 /100 | #238 | Tragic $44,419 |
| Senegalese | 5.3 /100 | #239 | Tragic $44,373 |
| Aleuts | 4.4 /100 | #240 | Tragic $44,241 |
| Samoans | 4.2 /100 | #241 | Tragic $44,206 |
| Immigrants | Venezuela | 4.0 /100 | #242 | Tragic $44,163 |
| Sub-Saharan Africans | 3.7 /100 | #243 | Tragic $44,118 |
| Immigrants | Nonimmigrants | 3.7 /100 | #244 | Tragic $44,117 |