Russian vs Immigrants from Belgium Male Poverty
COMPARE
Russian
Immigrants from Belgium
Male Poverty
Male Poverty Comparison
Russians
Immigrants from Belgium
9.9%
MALE POVERTY
99.2/ 100
METRIC RATING
39th/ 347
METRIC RANK
10.3%
MALE POVERTY
96.8/ 100
METRIC RATING
77th/ 347
METRIC RANK
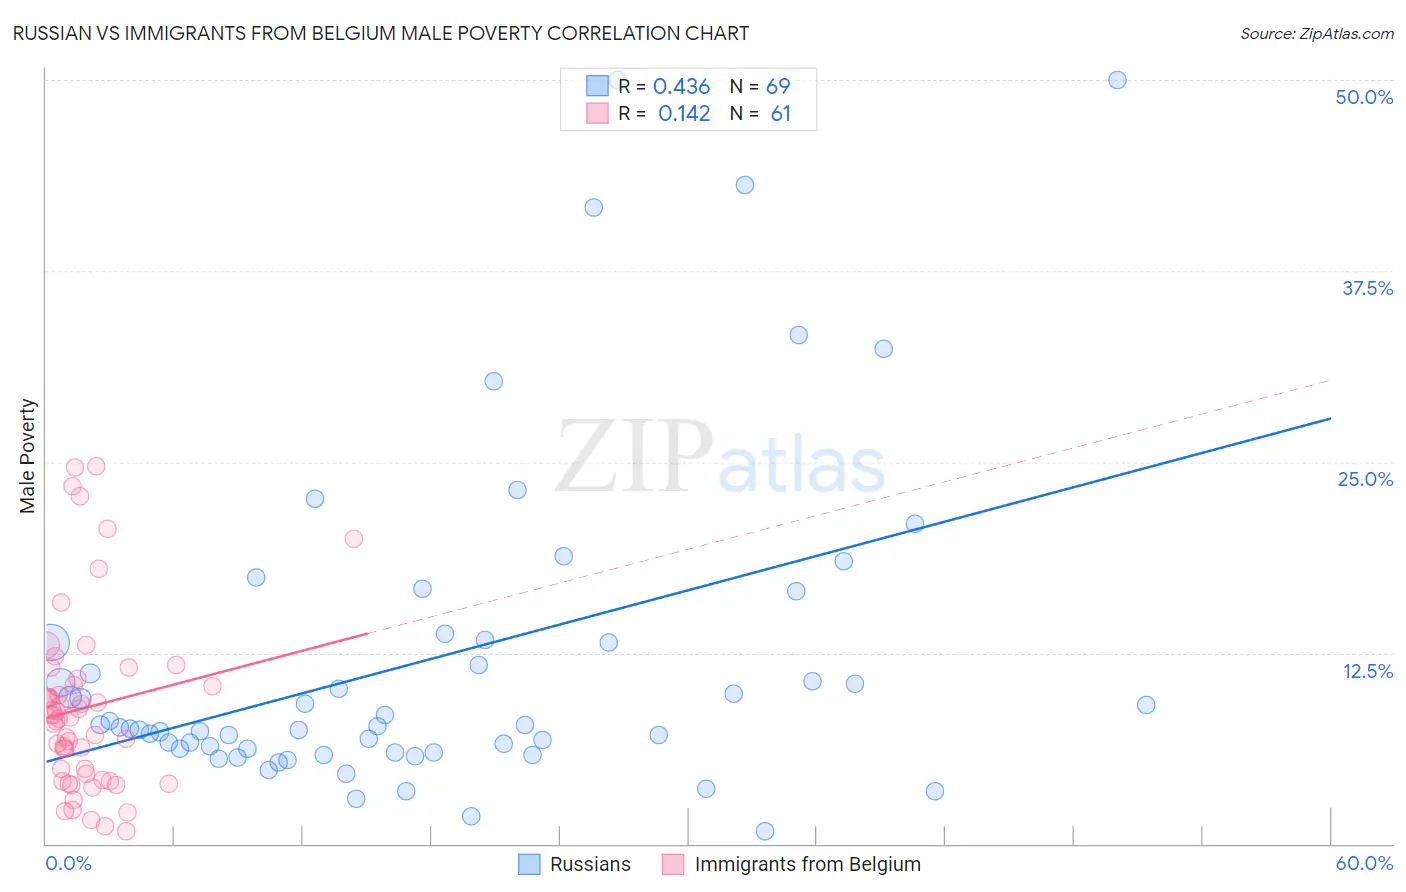
Russian vs Immigrants from Belgium Male Poverty Correlation Chart
The statistical analysis conducted on geographies consisting of 511,199,815 people shows a moderate positive correlation between the proportion of Russians and poverty level among males in the United States with a correlation coefficient (R) of 0.436 and weighted average of 9.9%. Similarly, the statistical analysis conducted on geographies consisting of 146,693,310 people shows a poor positive correlation between the proportion of Immigrants from Belgium and poverty level among males in the United States with a correlation coefficient (R) of 0.142 and weighted average of 10.3%, a difference of 4.0%.
Male Poverty Correlation Summary
| Measurement | Russian | Immigrants from Belgium |
| Minimum | 0.81% | 0.79% |
| Maximum | 50.0% | 24.7% |
| Range | 49.2% | 23.9% |
| Mean | 12.1% | 8.9% |
| Median | 7.7% | 8.3% |
| Interquartile 25% (IQ1) | 6.1% | 4.4% |
| Interquartile 75% (IQ3) | 13.3% | 10.6% |
| Interquartile Range (IQR) | 7.2% | 6.2% |
| Standard Deviation (Sample) | 10.8% | 5.8% |
| Standard Deviation (Population) | 10.8% | 5.8% |
Similar Demographics by Male Poverty
Demographics Similar to Russians by Male Poverty
In terms of male poverty, the demographic groups most similar to Russians are Immigrants from Pakistan (9.9%, a difference of 0.010%), Cypriot (9.9%, a difference of 0.080%), Korean (9.9%, a difference of 0.17%), Immigrants from Greece (9.8%, a difference of 0.38%), and Immigrants from Iran (9.9%, a difference of 0.42%).
| Demographics | Rating | Rank | Male Poverty |
| Macedonians | 99.5 /100 | #32 | Exceptional 9.7% |
| Immigrants | Northern Europe | 99.5 /100 | #33 | Exceptional 9.7% |
| Immigrants | Poland | 99.5 /100 | #34 | Exceptional 9.8% |
| Iranians | 99.4 /100 | #35 | Exceptional 9.8% |
| Czechs | 99.4 /100 | #36 | Exceptional 9.8% |
| Immigrants | Greece | 99.3 /100 | #37 | Exceptional 9.8% |
| Immigrants | Pakistan | 99.2 /100 | #38 | Exceptional 9.9% |
| Russians | 99.2 /100 | #39 | Exceptional 9.9% |
| Cypriots | 99.2 /100 | #40 | Exceptional 9.9% |
| Koreans | 99.2 /100 | #41 | Exceptional 9.9% |
| Immigrants | Iran | 99.1 /100 | #42 | Exceptional 9.9% |
| Immigrants | Moldova | 99.0 /100 | #43 | Exceptional 9.9% |
| Immigrants | Romania | 98.9 /100 | #44 | Exceptional 9.9% |
| Immigrants | Serbia | 98.9 /100 | #45 | Exceptional 10.0% |
| Turks | 98.9 /100 | #46 | Exceptional 10.0% |
Demographics Similar to Immigrants from Belgium by Male Poverty
In terms of male poverty, the demographic groups most similar to Immigrants from Belgium are Irish (10.3%, a difference of 0.020%), Dutch (10.2%, a difference of 0.030%), Immigrants from Eastern Europe (10.2%, a difference of 0.040%), Carpatho Rusyn (10.2%, a difference of 0.040%), and Immigrants from Asia (10.2%, a difference of 0.12%).
| Demographics | Rating | Rank | Male Poverty |
| Paraguayans | 97.1 /100 | #70 | Exceptional 10.2% |
| Europeans | 97.1 /100 | #71 | Exceptional 10.2% |
| Immigrants | Canada | 97.1 /100 | #72 | Exceptional 10.2% |
| Immigrants | Asia | 97.0 /100 | #73 | Exceptional 10.2% |
| Immigrants | Eastern Europe | 96.9 /100 | #74 | Exceptional 10.2% |
| Carpatho Rusyns | 96.9 /100 | #75 | Exceptional 10.2% |
| Dutch | 96.9 /100 | #76 | Exceptional 10.2% |
| Immigrants | Belgium | 96.8 /100 | #77 | Exceptional 10.3% |
| Irish | 96.8 /100 | #78 | Exceptional 10.3% |
| Immigrants | North America | 96.5 /100 | #79 | Exceptional 10.3% |
| English | 96.4 /100 | #80 | Exceptional 10.3% |
| Belgians | 95.9 /100 | #81 | Exceptional 10.3% |
| Egyptians | 95.9 /100 | #82 | Exceptional 10.3% |
| Immigrants | Sweden | 95.7 /100 | #83 | Exceptional 10.3% |
| Czechoslovakians | 95.6 /100 | #84 | Exceptional 10.3% |