Immigrants from Lithuania vs Immigrants from Belgium Median Earnings
COMPARE
Immigrants from Lithuania
Immigrants from Belgium
Median Earnings
Median Earnings Comparison
Immigrants from Lithuania
Immigrants from Belgium
$52,769
MEDIAN EARNINGS
100.0/ 100
METRIC RATING
41st/ 347
METRIC RANK
$54,679
MEDIAN EARNINGS
100.0/ 100
METRIC RATING
19th/ 347
METRIC RANK
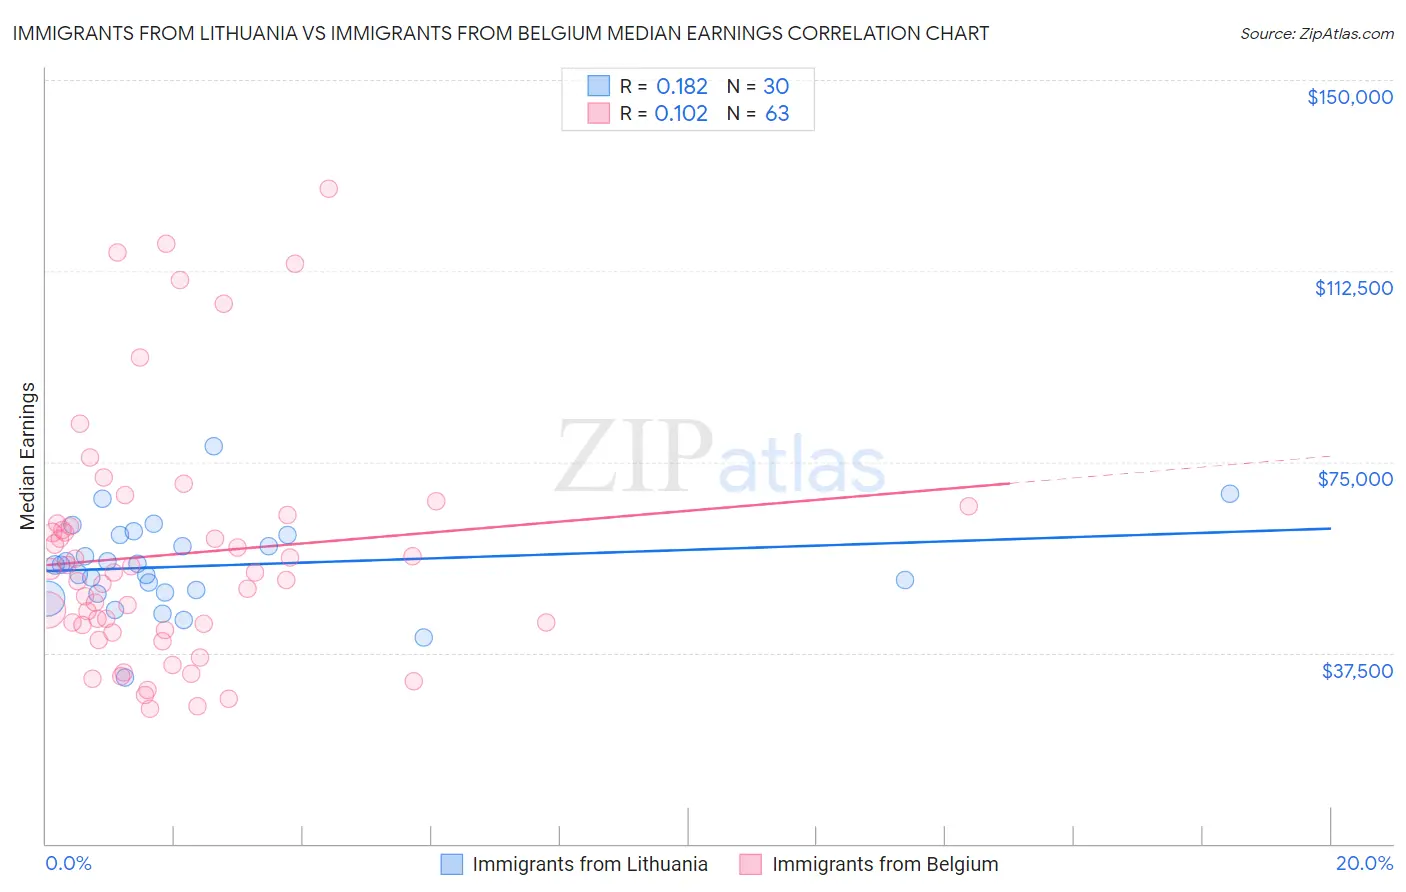
Immigrants from Lithuania vs Immigrants from Belgium Median Earnings Correlation Chart
The statistical analysis conducted on geographies consisting of 117,724,669 people shows a poor positive correlation between the proportion of Immigrants from Lithuania and median earnings in the United States with a correlation coefficient (R) of 0.182 and weighted average of $52,769. Similarly, the statistical analysis conducted on geographies consisting of 146,713,420 people shows a poor positive correlation between the proportion of Immigrants from Belgium and median earnings in the United States with a correlation coefficient (R) of 0.102 and weighted average of $54,679, a difference of 3.6%.
Median Earnings Correlation Summary
| Measurement | Immigrants from Lithuania | Immigrants from Belgium |
| Minimum | $32,646 | $26,625 |
| Maximum | $78,046 | $128,750 |
| Range | $45,400 | $102,125 |
| Mean | $54,582 | $56,854 |
| Median | $54,749 | $53,265 |
| Interquartile 25% (IQ1) | $49,388 | $41,924 |
| Interquartile 75% (IQ3) | $60,605 | $62,836 |
| Interquartile Range (IQR) | $11,217 | $20,912 |
| Standard Deviation (Sample) | $8,932 | $23,786 |
| Standard Deviation (Population) | $8,782 | $23,597 |
Similar Demographics by Median Earnings
Demographics Similar to Immigrants from Lithuania by Median Earnings
In terms of median earnings, the demographic groups most similar to Immigrants from Lithuania are Israeli ($52,937, a difference of 0.32%), Immigrants from Turkey ($52,960, a difference of 0.36%), Latvian ($53,001, a difference of 0.44%), Maltese ($52,526, a difference of 0.46%), and Immigrants from Malaysia ($52,514, a difference of 0.49%).
| Demographics | Rating | Rank | Median Earnings |
| Immigrants | Sri Lanka | 100.0 /100 | #34 | Exceptional $53,268 |
| Immigrants | Switzerland | 100.0 /100 | #35 | Exceptional $53,211 |
| Immigrants | Denmark | 100.0 /100 | #36 | Exceptional $53,186 |
| Immigrants | Belarus | 100.0 /100 | #37 | Exceptional $53,043 |
| Latvians | 100.0 /100 | #38 | Exceptional $53,001 |
| Immigrants | Turkey | 100.0 /100 | #39 | Exceptional $52,960 |
| Israelis | 100.0 /100 | #40 | Exceptional $52,937 |
| Immigrants | Lithuania | 100.0 /100 | #41 | Exceptional $52,769 |
| Maltese | 100.0 /100 | #42 | Exceptional $52,526 |
| Immigrants | Malaysia | 100.0 /100 | #43 | Exceptional $52,514 |
| Bulgarians | 100.0 /100 | #44 | Exceptional $52,512 |
| Immigrants | Czechoslovakia | 100.0 /100 | #45 | Exceptional $52,361 |
| Bhutanese | 100.0 /100 | #46 | Exceptional $52,297 |
| Australians | 100.0 /100 | #47 | Exceptional $52,294 |
| Immigrants | Europe | 100.0 /100 | #48 | Exceptional $52,195 |
Demographics Similar to Immigrants from Belgium by Median Earnings
In terms of median earnings, the demographic groups most similar to Immigrants from Belgium are Cypriot ($54,589, a difference of 0.16%), Burmese ($54,559, a difference of 0.22%), Immigrants from Korea ($54,530, a difference of 0.27%), Immigrants from Sweden ($54,478, a difference of 0.37%), and Immigrants from Japan ($54,938, a difference of 0.47%).
| Demographics | Rating | Rank | Median Earnings |
| Immigrants | Ireland | 100.0 /100 | #12 | Exceptional $56,854 |
| Immigrants | China | 100.0 /100 | #13 | Exceptional $56,638 |
| Immigrants | Australia | 100.0 /100 | #14 | Exceptional $56,305 |
| Indians (Asian) | 100.0 /100 | #15 | Exceptional $56,253 |
| Immigrants | Eastern Asia | 100.0 /100 | #16 | Exceptional $56,183 |
| Eastern Europeans | 100.0 /100 | #17 | Exceptional $55,084 |
| Immigrants | Japan | 100.0 /100 | #18 | Exceptional $54,938 |
| Immigrants | Belgium | 100.0 /100 | #19 | Exceptional $54,679 |
| Cypriots | 100.0 /100 | #20 | Exceptional $54,589 |
| Burmese | 100.0 /100 | #21 | Exceptional $54,559 |
| Immigrants | Korea | 100.0 /100 | #22 | Exceptional $54,530 |
| Immigrants | Sweden | 100.0 /100 | #23 | Exceptional $54,478 |
| Soviet Union | 100.0 /100 | #24 | Exceptional $54,290 |
| Turks | 100.0 /100 | #25 | Exceptional $53,919 |
| Immigrants | Northern Europe | 100.0 /100 | #26 | Exceptional $53,872 |