Russian vs African Median Earnings
COMPARE
Russian
African
Median Earnings
Median Earnings Comparison
Russians
Africans
$53,334
MEDIAN EARNINGS
100.0/ 100
METRIC RATING
31st/ 347
METRIC RANK
$41,955
MEDIAN EARNINGS
0.2/ 100
METRIC RATING
282nd/ 347
METRIC RANK
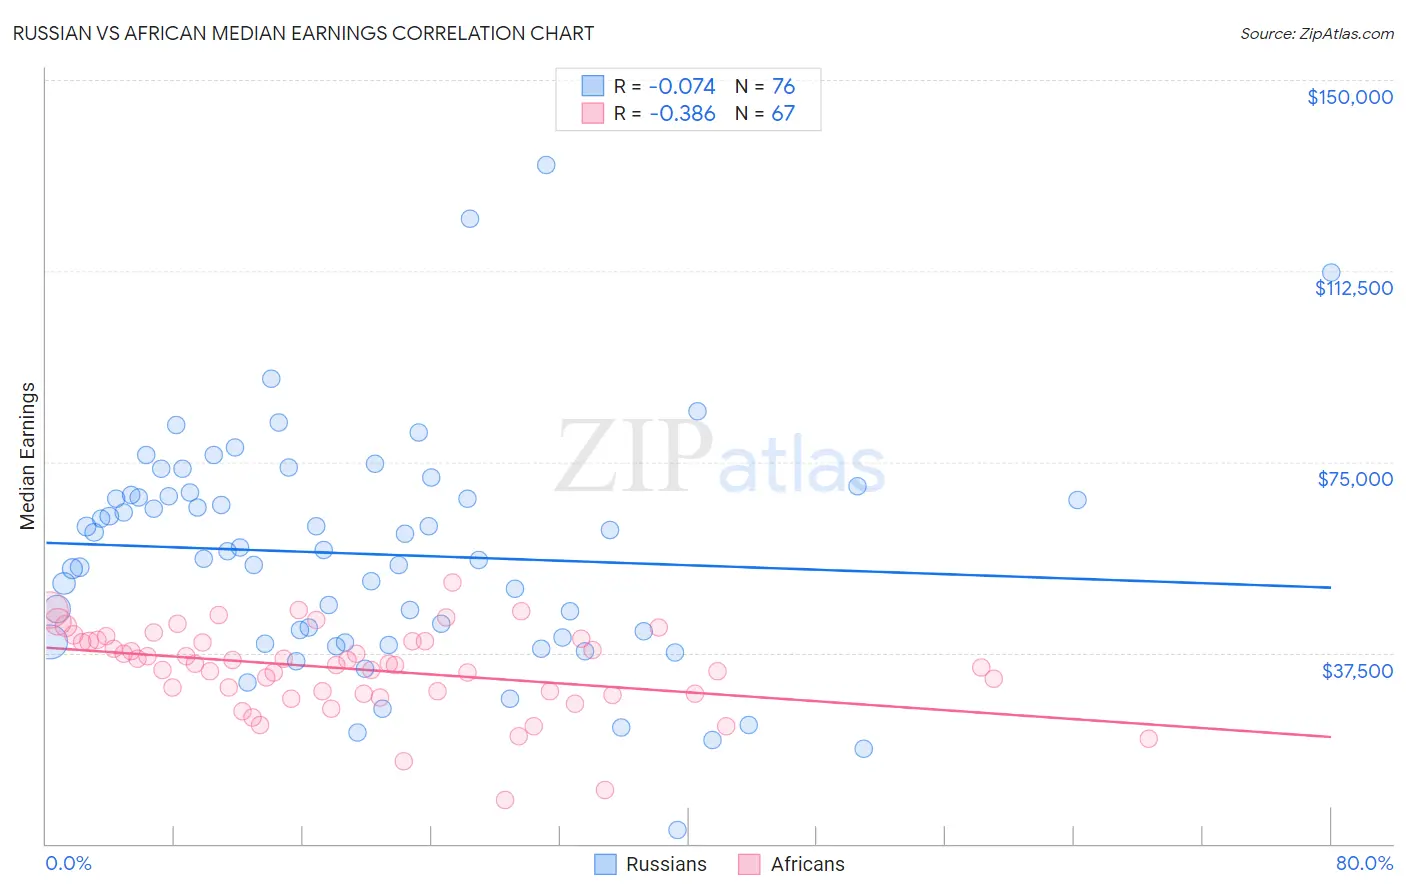
Russian vs African Median Earnings Correlation Chart
The statistical analysis conducted on geographies consisting of 512,155,619 people shows a slight negative correlation between the proportion of Russians and median earnings in the United States with a correlation coefficient (R) of -0.074 and weighted average of $53,334. Similarly, the statistical analysis conducted on geographies consisting of 470,066,359 people shows a mild negative correlation between the proportion of Africans and median earnings in the United States with a correlation coefficient (R) of -0.386 and weighted average of $41,955, a difference of 27.1%.
Median Earnings Correlation Summary
| Measurement | Russian | African |
| Minimum | $2,766 | $8,672 |
| Maximum | $133,235 | $51,324 |
| Range | $130,469 | $42,652 |
| Mean | $56,899 | $34,249 |
| Median | $57,547 | $35,314 |
| Interquartile 25% (IQ1) | $40,132 | $29,519 |
| Interquartile 75% (IQ3) | $68,448 | $39,743 |
| Interquartile Range (IQR) | $28,315 | $10,224 |
| Standard Deviation (Sample) | $22,580 | $8,278 |
| Standard Deviation (Population) | $22,431 | $8,216 |
Similar Demographics by Median Earnings
Demographics Similar to Russians by Median Earnings
In terms of median earnings, the demographic groups most similar to Russians are Immigrants from Asia ($53,310, a difference of 0.040%), Cambodian ($53,386, a difference of 0.10%), Immigrants from Greece ($53,282, a difference of 0.10%), Immigrants from Sri Lanka ($53,268, a difference of 0.12%), and Immigrants from Russia ($53,457, a difference of 0.23%).
| Demographics | Rating | Rank | Median Earnings |
| Soviet Union | 100.0 /100 | #24 | Exceptional $54,290 |
| Turks | 100.0 /100 | #25 | Exceptional $53,919 |
| Immigrants | Northern Europe | 100.0 /100 | #26 | Exceptional $53,872 |
| Asians | 100.0 /100 | #27 | Exceptional $53,690 |
| Immigrants | France | 100.0 /100 | #28 | Exceptional $53,490 |
| Immigrants | Russia | 100.0 /100 | #29 | Exceptional $53,457 |
| Cambodians | 100.0 /100 | #30 | Exceptional $53,386 |
| Russians | 100.0 /100 | #31 | Exceptional $53,334 |
| Immigrants | Asia | 100.0 /100 | #32 | Exceptional $53,310 |
| Immigrants | Greece | 100.0 /100 | #33 | Exceptional $53,282 |
| Immigrants | Sri Lanka | 100.0 /100 | #34 | Exceptional $53,268 |
| Immigrants | Switzerland | 100.0 /100 | #35 | Exceptional $53,211 |
| Immigrants | Denmark | 100.0 /100 | #36 | Exceptional $53,186 |
| Immigrants | Belarus | 100.0 /100 | #37 | Exceptional $53,043 |
| Latvians | 100.0 /100 | #38 | Exceptional $53,001 |
Demographics Similar to Africans by Median Earnings
In terms of median earnings, the demographic groups most similar to Africans are Marshallese ($41,969, a difference of 0.030%), Dominican ($41,864, a difference of 0.22%), Blackfeet ($41,822, a difference of 0.32%), Hmong ($42,111, a difference of 0.37%), and Colville ($42,151, a difference of 0.47%).
| Demographics | Rating | Rank | Median Earnings |
| Immigrants | Belize | 0.3 /100 | #275 | Tragic $42,339 |
| Spanish Americans | 0.3 /100 | #276 | Tragic $42,316 |
| Central Americans | 0.3 /100 | #277 | Tragic $42,280 |
| Cajuns | 0.3 /100 | #278 | Tragic $42,189 |
| Colville | 0.2 /100 | #279 | Tragic $42,151 |
| Hmong | 0.2 /100 | #280 | Tragic $42,111 |
| Marshallese | 0.2 /100 | #281 | Tragic $41,969 |
| Africans | 0.2 /100 | #282 | Tragic $41,955 |
| Dominicans | 0.2 /100 | #283 | Tragic $41,864 |
| Blackfeet | 0.2 /100 | #284 | Tragic $41,822 |
| Immigrants | Nicaragua | 0.1 /100 | #285 | Tragic $41,737 |
| Mexican American Indians | 0.1 /100 | #286 | Tragic $41,719 |
| Indonesians | 0.1 /100 | #287 | Tragic $41,701 |
| Immigrants | Dominican Republic | 0.1 /100 | #288 | Tragic $41,554 |
| Comanche | 0.1 /100 | #289 | Tragic $41,519 |