Russian vs Estonian Female Disability
COMPARE
Russian
Estonian
Female Disability
Female Disability Comparison
Russians
Estonians
11.8%
FEMALE DISABILITY
96.5/ 100
METRIC RATING
124th/ 347
METRIC RANK
12.0%
FEMALE DISABILITY
87.8/ 100
METRIC RATING
145th/ 347
METRIC RANK
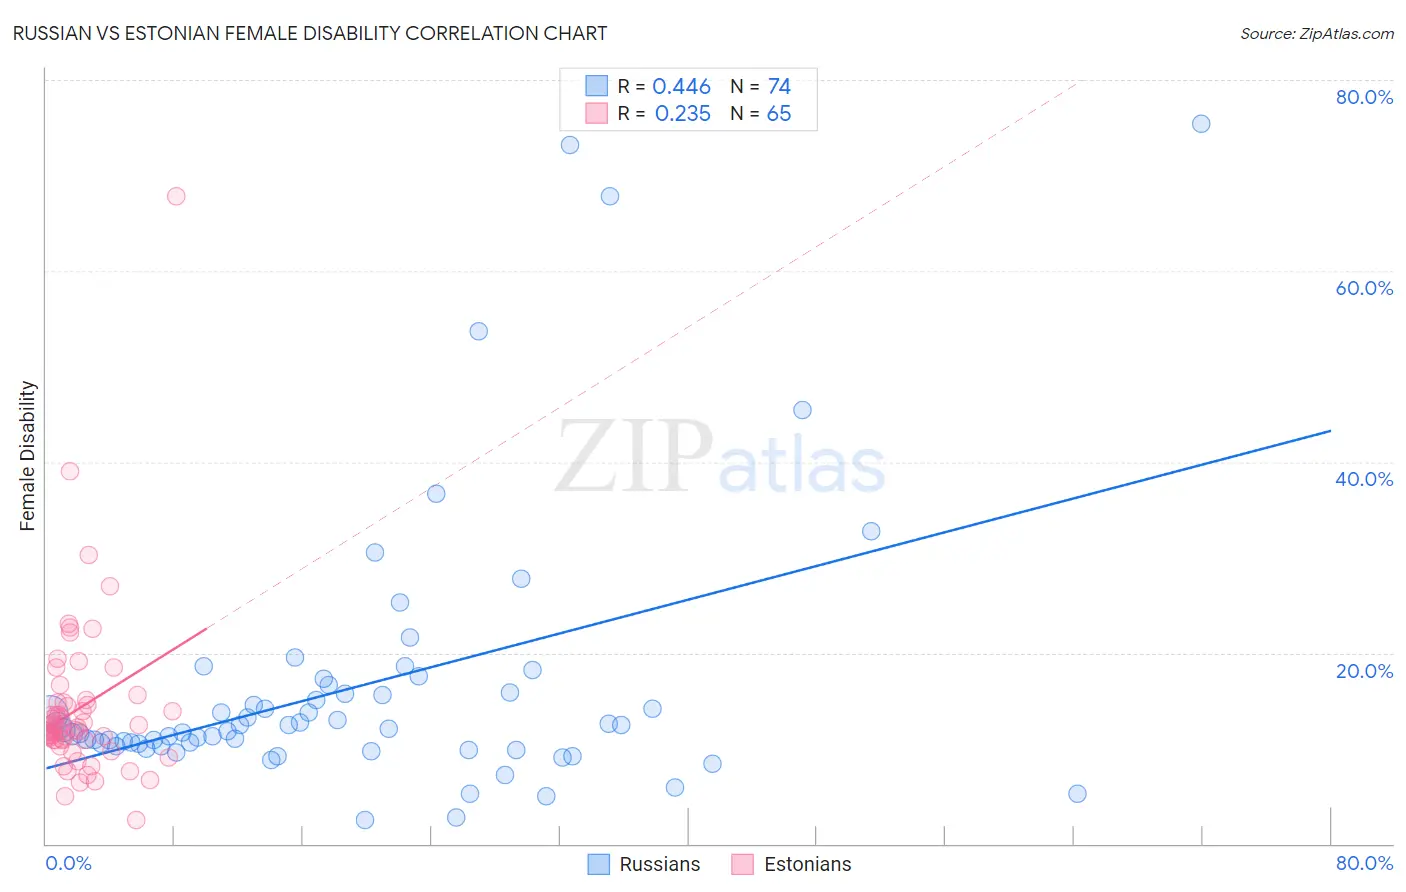
Russian vs Estonian Female Disability Correlation Chart
The statistical analysis conducted on geographies consisting of 512,105,615 people shows a moderate positive correlation between the proportion of Russians and percentage of females with a disability in the United States with a correlation coefficient (R) of 0.446 and weighted average of 11.8%. Similarly, the statistical analysis conducted on geographies consisting of 123,526,359 people shows a weak positive correlation between the proportion of Estonians and percentage of females with a disability in the United States with a correlation coefficient (R) of 0.235 and weighted average of 12.0%, a difference of 1.3%.
Female Disability Correlation Summary
| Measurement | Russian | Estonian |
| Minimum | 2.5% | 2.4% |
| Maximum | 75.4% | 67.8% |
| Range | 73.0% | 65.4% |
| Mean | 16.5% | 14.2% |
| Median | 12.0% | 12.1% |
| Interquartile 25% (IQ1) | 10.3% | 10.8% |
| Interquartile 75% (IQ3) | 15.8% | 14.8% |
| Interquartile Range (IQR) | 5.5% | 3.9% |
| Standard Deviation (Sample) | 14.3% | 9.0% |
| Standard Deviation (Population) | 14.2% | 8.9% |
Similar Demographics by Female Disability
Demographics Similar to Russians by Female Disability
In terms of female disability, the demographic groups most similar to Russians are Immigrants from Italy (11.8%, a difference of 0.030%), Immigrants from Croatia (11.8%, a difference of 0.050%), Immigrants from Europe (11.8%, a difference of 0.090%), Immigrants from North Macedonia (11.8%, a difference of 0.10%), and Immigrants from Netherlands (11.8%, a difference of 0.11%).
| Demographics | Rating | Rank | Female Disability |
| Immigrants | Eastern Europe | 97.2 /100 | #117 | Exceptional 11.8% |
| Immigrants | Nigeria | 97.2 /100 | #118 | Exceptional 11.8% |
| Immigrants | Uganda | 97.2 /100 | #119 | Exceptional 11.8% |
| Immigrants | Kazakhstan | 97.0 /100 | #120 | Exceptional 11.8% |
| Immigrants | Netherlands | 96.9 /100 | #121 | Exceptional 11.8% |
| Immigrants | North Macedonia | 96.8 /100 | #122 | Exceptional 11.8% |
| Immigrants | Croatia | 96.7 /100 | #123 | Exceptional 11.8% |
| Russians | 96.5 /100 | #124 | Exceptional 11.8% |
| Immigrants | Italy | 96.4 /100 | #125 | Exceptional 11.8% |
| Immigrants | Europe | 96.2 /100 | #126 | Exceptional 11.8% |
| South American Indians | 95.8 /100 | #127 | Exceptional 11.8% |
| Immigrants | Latvia | 95.6 /100 | #128 | Exceptional 11.8% |
| Macedonians | 95.5 /100 | #129 | Exceptional 11.8% |
| Nicaraguans | 95.2 /100 | #130 | Exceptional 11.9% |
| Arabs | 95.1 /100 | #131 | Exceptional 11.9% |
Demographics Similar to Estonians by Female Disability
In terms of female disability, the demographic groups most similar to Estonians are Immigrants from Austria (12.0%, a difference of 0.0%), Immigrants from Sudan (11.9%, a difference of 0.17%), Immigrants from Africa (11.9%, a difference of 0.21%), Pakistani (12.0%, a difference of 0.26%), and Nigerian (12.0%, a difference of 0.30%).
| Demographics | Rating | Rank | Female Disability |
| Ecuadorians | 93.4 /100 | #138 | Exceptional 11.9% |
| Immigrants | Hungary | 92.8 /100 | #139 | Exceptional 11.9% |
| Romanians | 91.6 /100 | #140 | Exceptional 11.9% |
| Immigrants | Ecuador | 91.5 /100 | #141 | Exceptional 11.9% |
| Immigrants | Africa | 90.0 /100 | #142 | Excellent 11.9% |
| Immigrants | Sudan | 89.6 /100 | #143 | Excellent 11.9% |
| Immigrants | Austria | 87.9 /100 | #144 | Excellent 12.0% |
| Estonians | 87.8 /100 | #145 | Excellent 12.0% |
| Pakistanis | 84.6 /100 | #146 | Excellent 12.0% |
| Nigerians | 84.0 /100 | #147 | Excellent 12.0% |
| Immigrants | Kenya | 83.1 /100 | #148 | Excellent 12.0% |
| Greeks | 82.0 /100 | #149 | Excellent 12.0% |
| Immigrants | Moldova | 81.4 /100 | #150 | Excellent 12.0% |
| Icelanders | 80.7 /100 | #151 | Excellent 12.0% |
| Immigrants | Scotland | 79.3 /100 | #152 | Good 12.0% |