Turkish vs Iranian Median Family Income
COMPARE
Turkish
Iranian
Median Family Income
Median Family Income Comparison
Turks
Iranians
$121,202
MEDIAN FAMILY INCOME
100.0/ 100
METRIC RATING
25th/ 347
METRIC RANK
$133,839
MEDIAN FAMILY INCOME
100.0/ 100
METRIC RATING
5th/ 347
METRIC RANK
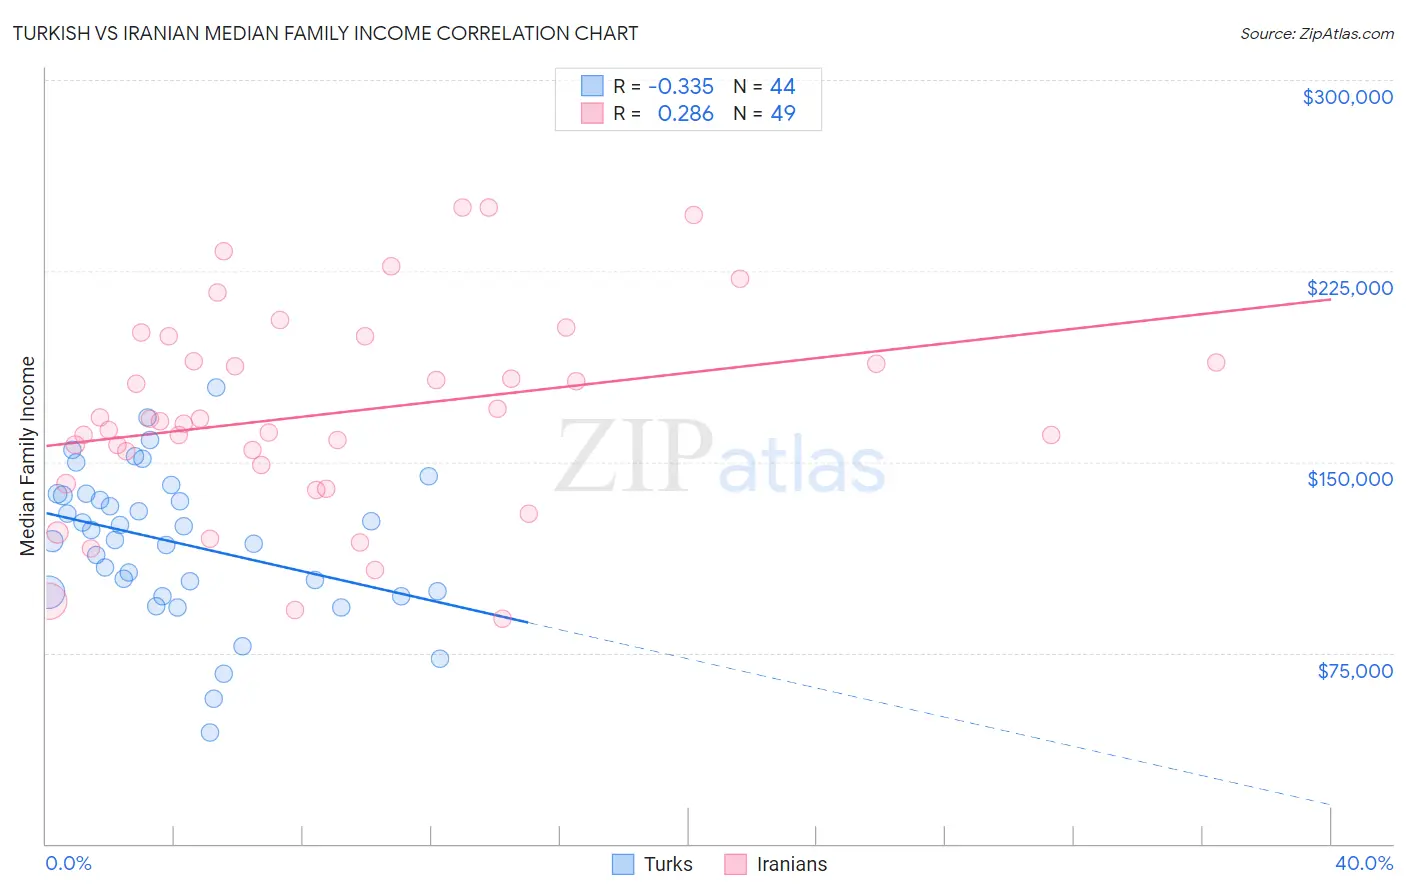
Turkish vs Iranian Median Family Income Correlation Chart
The statistical analysis conducted on geographies consisting of 271,625,572 people shows a mild negative correlation between the proportion of Turks and median family income in the United States with a correlation coefficient (R) of -0.335 and weighted average of $121,202. Similarly, the statistical analysis conducted on geographies consisting of 316,569,365 people shows a weak positive correlation between the proportion of Iranians and median family income in the United States with a correlation coefficient (R) of 0.286 and weighted average of $133,839, a difference of 10.4%.
Median Family Income Correlation Summary
| Measurement | Turkish | Iranian |
| Minimum | $43,750 | $88,250 |
| Maximum | $179,091 | $250,001 |
| Range | $135,341 | $161,751 |
| Mean | $118,204 | $169,044 |
| Median | $121,237 | $166,027 |
| Interquartile 25% (IQ1) | $99,051 | $144,981 |
| Interquartile 75% (IQ3) | $137,062 | $194,217 |
| Interquartile Range (IQR) | $38,011 | $49,236 |
| Standard Deviation (Sample) | $28,920 | $39,948 |
| Standard Deviation (Population) | $28,590 | $39,538 |
Demographics Similar to Turks and Iranians by Median Family Income
In terms of median family income, the demographic groups most similar to Turks are Immigrants from Northern Europe ($121,840, a difference of 0.53%), Immigrants from Sweden ($122,765, a difference of 1.3%), Immigrants from Japan ($122,764, a difference of 1.3%), Immigrants from Korea ($122,800, a difference of 1.3%), and Burmese ($123,369, a difference of 1.8%). Similarly, the demographic groups most similar to Iranians are Thai ($131,281, a difference of 1.9%), Immigrants from Hong Kong ($131,067, a difference of 2.1%), Immigrants from Iran ($130,894, a difference of 2.2%), Okinawan ($129,979, a difference of 3.0%), and Immigrants from Ireland ($127,584, a difference of 4.9%).
| Demographics | Rating | Rank | Median Family Income |
| Iranians | 100.0 /100 | #5 | Exceptional $133,839 |
| Thais | 100.0 /100 | #6 | Exceptional $131,281 |
| Immigrants | Hong Kong | 100.0 /100 | #7 | Exceptional $131,067 |
| Immigrants | Iran | 100.0 /100 | #8 | Exceptional $130,894 |
| Okinawans | 100.0 /100 | #9 | Exceptional $129,979 |
| Immigrants | Ireland | 100.0 /100 | #10 | Exceptional $127,584 |
| Immigrants | Israel | 100.0 /100 | #11 | Exceptional $127,430 |
| Cypriots | 100.0 /100 | #12 | Exceptional $127,064 |
| Immigrants | Australia | 100.0 /100 | #13 | Exceptional $126,620 |
| Immigrants | South Central Asia | 100.0 /100 | #14 | Exceptional $125,956 |
| Eastern Europeans | 100.0 /100 | #15 | Exceptional $125,546 |
| Immigrants | China | 100.0 /100 | #16 | Exceptional $125,540 |
| Indians (Asian) | 100.0 /100 | #17 | Exceptional $125,312 |
| Immigrants | Eastern Asia | 100.0 /100 | #18 | Exceptional $125,150 |
| Immigrants | Belgium | 100.0 /100 | #19 | Exceptional $123,831 |
| Burmese | 100.0 /100 | #20 | Exceptional $123,369 |
| Immigrants | Korea | 100.0 /100 | #21 | Exceptional $122,800 |
| Immigrants | Sweden | 100.0 /100 | #22 | Exceptional $122,765 |
| Immigrants | Japan | 100.0 /100 | #23 | Exceptional $122,764 |
| Immigrants | Northern Europe | 100.0 /100 | #24 | Exceptional $121,840 |
| Turks | 100.0 /100 | #25 | Exceptional $121,202 |