Jordanian vs Iranian Median Family Income
COMPARE
Jordanian
Iranian
Median Family Income
Median Family Income Comparison
Jordanians
Iranians
$109,865
MEDIAN FAMILY INCOME
97.5/ 100
METRIC RATING
97th/ 347
METRIC RANK
$133,839
MEDIAN FAMILY INCOME
100.0/ 100
METRIC RATING
5th/ 347
METRIC RANK
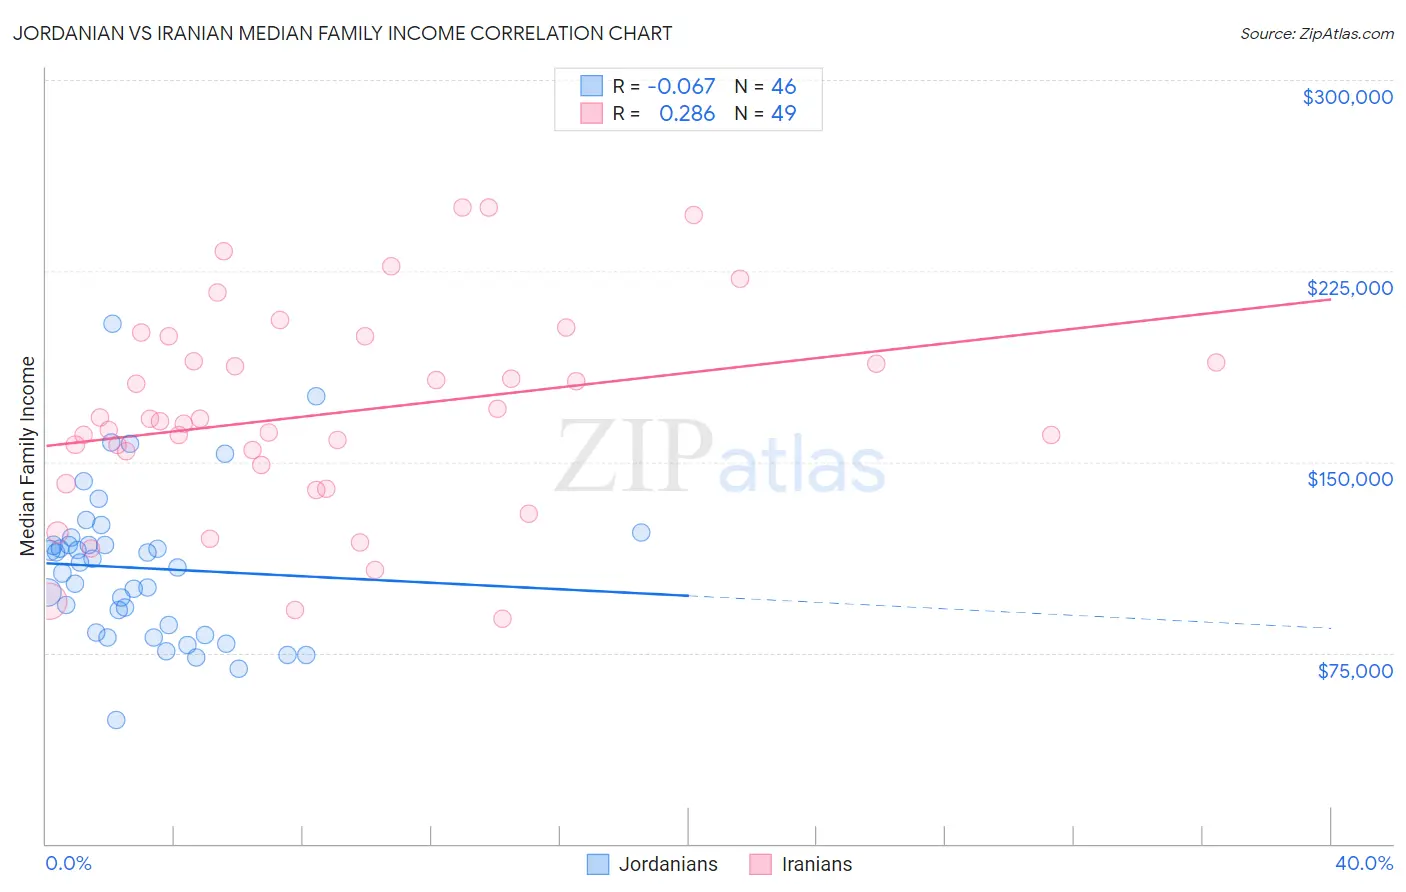
Jordanian vs Iranian Median Family Income Correlation Chart
The statistical analysis conducted on geographies consisting of 166,350,373 people shows a slight negative correlation between the proportion of Jordanians and median family income in the United States with a correlation coefficient (R) of -0.067 and weighted average of $109,865. Similarly, the statistical analysis conducted on geographies consisting of 316,569,365 people shows a weak positive correlation between the proportion of Iranians and median family income in the United States with a correlation coefficient (R) of 0.286 and weighted average of $133,839, a difference of 21.8%.
Median Family Income Correlation Summary
| Measurement | Jordanian | Iranian |
| Minimum | $48,661 | $88,250 |
| Maximum | $204,272 | $250,001 |
| Range | $155,611 | $161,751 |
| Mean | $108,250 | $169,044 |
| Median | $109,650 | $166,027 |
| Interquartile 25% (IQ1) | $82,841 | $144,981 |
| Interquartile 75% (IQ3) | $117,365 | $194,217 |
| Interquartile Range (IQR) | $34,524 | $49,236 |
| Standard Deviation (Sample) | $29,858 | $39,948 |
| Standard Deviation (Population) | $29,532 | $39,538 |
Similar Demographics by Median Family Income
Demographics Similar to Jordanians by Median Family Income
In terms of median family income, the demographic groups most similar to Jordanians are Immigrants from Moldova ($109,975, a difference of 0.10%), Immigrants from Kuwait ($109,731, a difference of 0.12%), Zimbabwean ($110,011, a difference of 0.13%), Armenian ($109,692, a difference of 0.16%), and Macedonian ($109,668, a difference of 0.18%).
| Demographics | Rating | Rank | Median Family Income |
| Northern Europeans | 98.3 /100 | #90 | Exceptional $110,635 |
| Immigrants | Southern Europe | 98.3 /100 | #91 | Exceptional $110,614 |
| Immigrants | Lebanon | 97.9 /100 | #92 | Exceptional $110,159 |
| Immigrants | Kazakhstan | 97.8 /100 | #93 | Exceptional $110,137 |
| Koreans | 97.8 /100 | #94 | Exceptional $110,103 |
| Zimbabweans | 97.7 /100 | #95 | Exceptional $110,011 |
| Immigrants | Moldova | 97.7 /100 | #96 | Exceptional $109,975 |
| Jordanians | 97.5 /100 | #97 | Exceptional $109,865 |
| Immigrants | Kuwait | 97.4 /100 | #98 | Exceptional $109,731 |
| Armenians | 97.3 /100 | #99 | Exceptional $109,692 |
| Macedonians | 97.3 /100 | #100 | Exceptional $109,668 |
| Immigrants | Ukraine | 97.2 /100 | #101 | Exceptional $109,645 |
| Assyrians/Chaldeans/Syriacs | 97.2 /100 | #102 | Exceptional $109,622 |
| Immigrants | Brazil | 96.9 /100 | #103 | Exceptional $109,418 |
| Palestinians | 96.9 /100 | #104 | Exceptional $109,413 |
Demographics Similar to Iranians by Median Family Income
In terms of median family income, the demographic groups most similar to Iranians are Immigrants from India ($134,028, a difference of 0.14%), Immigrants from Singapore ($134,818, a difference of 0.73%), Thai ($131,281, a difference of 1.9%), Immigrants from Hong Kong ($131,067, a difference of 2.1%), and Immigrants from Iran ($130,894, a difference of 2.2%).
| Demographics | Rating | Rank | Median Family Income |
| Filipinos | 100.0 /100 | #1 | Exceptional $138,397 |
| Immigrants | Taiwan | 100.0 /100 | #2 | Exceptional $136,949 |
| Immigrants | Singapore | 100.0 /100 | #3 | Exceptional $134,818 |
| Immigrants | India | 100.0 /100 | #4 | Exceptional $134,028 |
| Iranians | 100.0 /100 | #5 | Exceptional $133,839 |
| Thais | 100.0 /100 | #6 | Exceptional $131,281 |
| Immigrants | Hong Kong | 100.0 /100 | #7 | Exceptional $131,067 |
| Immigrants | Iran | 100.0 /100 | #8 | Exceptional $130,894 |
| Okinawans | 100.0 /100 | #9 | Exceptional $129,979 |
| Immigrants | Ireland | 100.0 /100 | #10 | Exceptional $127,584 |
| Immigrants | Israel | 100.0 /100 | #11 | Exceptional $127,430 |
| Cypriots | 100.0 /100 | #12 | Exceptional $127,064 |
| Immigrants | Australia | 100.0 /100 | #13 | Exceptional $126,620 |
| Immigrants | South Central Asia | 100.0 /100 | #14 | Exceptional $125,956 |
| Eastern Europeans | 100.0 /100 | #15 | Exceptional $125,546 |