Immigrants from Congo vs Iranian Median Family Income
COMPARE
Immigrants from Congo
Iranian
Median Family Income
Median Family Income Comparison
Immigrants from Congo
Iranians
$82,216
MEDIAN FAMILY INCOME
0.0/ 100
METRIC RATING
326th/ 347
METRIC RANK
$133,839
MEDIAN FAMILY INCOME
100.0/ 100
METRIC RATING
5th/ 347
METRIC RANK
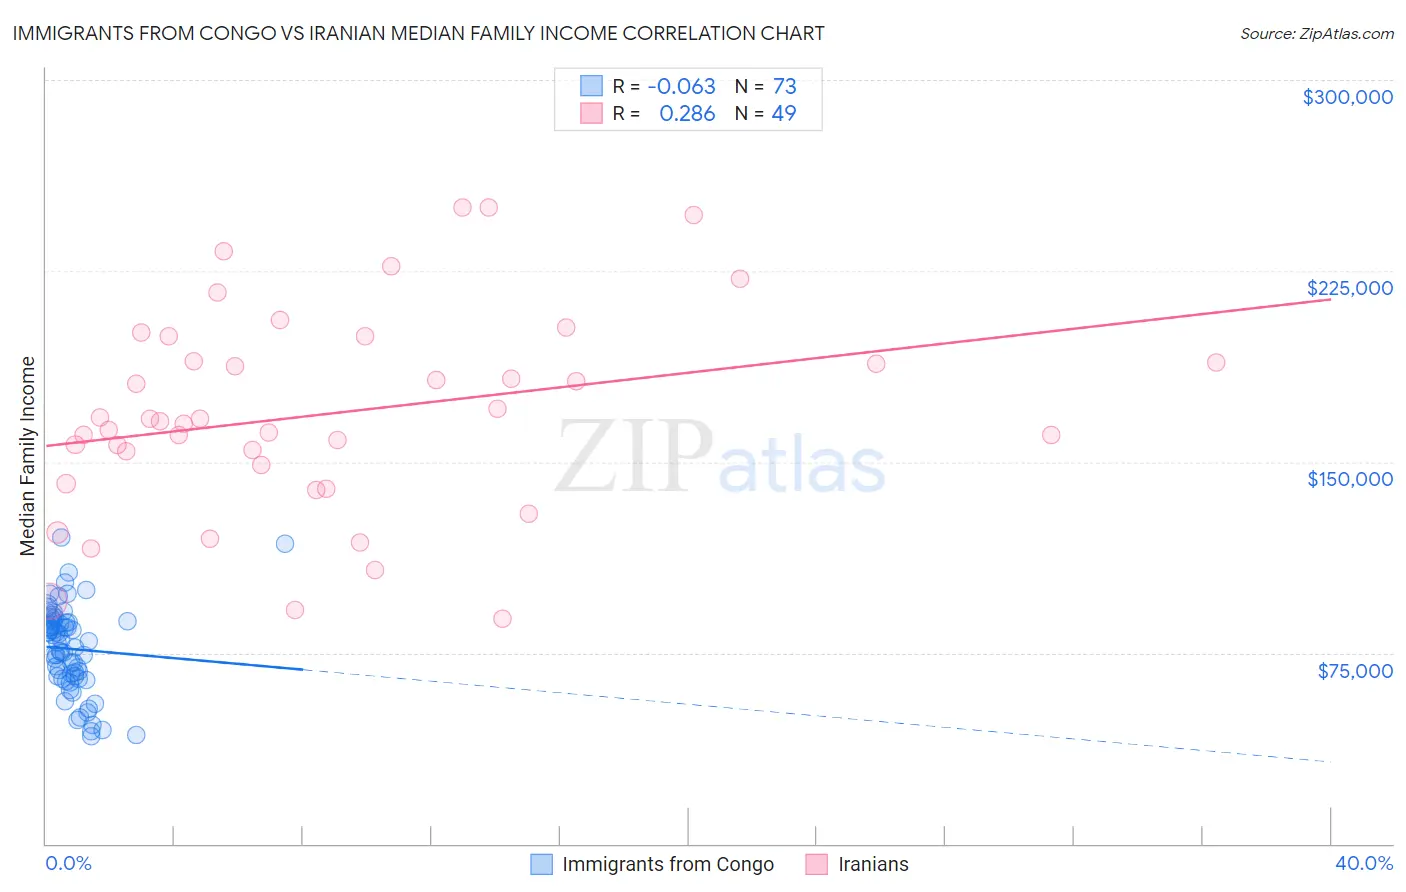
Immigrants from Congo vs Iranian Median Family Income Correlation Chart
The statistical analysis conducted on geographies consisting of 92,050,082 people shows a slight negative correlation between the proportion of Immigrants from Congo and median family income in the United States with a correlation coefficient (R) of -0.063 and weighted average of $82,216. Similarly, the statistical analysis conducted on geographies consisting of 316,569,365 people shows a weak positive correlation between the proportion of Iranians and median family income in the United States with a correlation coefficient (R) of 0.286 and weighted average of $133,839, a difference of 62.8%.
Median Family Income Correlation Summary
| Measurement | Immigrants from Congo | Iranian |
| Minimum | $42,229 | $88,250 |
| Maximum | $120,257 | $250,001 |
| Range | $78,028 | $161,751 |
| Mean | $76,553 | $169,044 |
| Median | $79,188 | $166,027 |
| Interquartile 25% (IQ1) | $65,174 | $144,981 |
| Interquartile 75% (IQ3) | $87,165 | $194,217 |
| Interquartile Range (IQR) | $21,991 | $49,236 |
| Standard Deviation (Sample) | $17,096 | $39,948 |
| Standard Deviation (Population) | $16,978 | $39,538 |
Similar Demographics by Median Family Income
Demographics Similar to Immigrants from Congo by Median Family Income
In terms of median family income, the demographic groups most similar to Immigrants from Congo are Arapaho ($82,064, a difference of 0.19%), Sioux ($82,386, a difference of 0.21%), Black/African American ($81,912, a difference of 0.37%), Creek ($82,560, a difference of 0.42%), and Dutch West Indian ($81,852, a difference of 0.45%).
| Demographics | Rating | Rank | Median Family Income |
| Immigrants | Honduras | 0.0 /100 | #319 | Tragic $83,618 |
| Seminole | 0.0 /100 | #320 | Tragic $83,354 |
| Immigrants | Caribbean | 0.0 /100 | #321 | Tragic $83,319 |
| Dominicans | 0.0 /100 | #322 | Tragic $82,888 |
| Bahamians | 0.0 /100 | #323 | Tragic $82,631 |
| Creek | 0.0 /100 | #324 | Tragic $82,560 |
| Sioux | 0.0 /100 | #325 | Tragic $82,386 |
| Immigrants | Congo | 0.0 /100 | #326 | Tragic $82,216 |
| Arapaho | 0.0 /100 | #327 | Tragic $82,064 |
| Blacks/African Americans | 0.0 /100 | #328 | Tragic $81,912 |
| Dutch West Indians | 0.0 /100 | #329 | Tragic $81,852 |
| Cheyenne | 0.0 /100 | #330 | Tragic $81,385 |
| Immigrants | Dominican Republic | 0.0 /100 | #331 | Tragic $81,233 |
| Natives/Alaskans | 0.0 /100 | #332 | Tragic $80,908 |
| Kiowa | 0.0 /100 | #333 | Tragic $80,885 |
Demographics Similar to Iranians by Median Family Income
In terms of median family income, the demographic groups most similar to Iranians are Immigrants from India ($134,028, a difference of 0.14%), Immigrants from Singapore ($134,818, a difference of 0.73%), Thai ($131,281, a difference of 1.9%), Immigrants from Hong Kong ($131,067, a difference of 2.1%), and Immigrants from Iran ($130,894, a difference of 2.2%).
| Demographics | Rating | Rank | Median Family Income |
| Filipinos | 100.0 /100 | #1 | Exceptional $138,397 |
| Immigrants | Taiwan | 100.0 /100 | #2 | Exceptional $136,949 |
| Immigrants | Singapore | 100.0 /100 | #3 | Exceptional $134,818 |
| Immigrants | India | 100.0 /100 | #4 | Exceptional $134,028 |
| Iranians | 100.0 /100 | #5 | Exceptional $133,839 |
| Thais | 100.0 /100 | #6 | Exceptional $131,281 |
| Immigrants | Hong Kong | 100.0 /100 | #7 | Exceptional $131,067 |
| Immigrants | Iran | 100.0 /100 | #8 | Exceptional $130,894 |
| Okinawans | 100.0 /100 | #9 | Exceptional $129,979 |
| Immigrants | Ireland | 100.0 /100 | #10 | Exceptional $127,584 |
| Immigrants | Israel | 100.0 /100 | #11 | Exceptional $127,430 |
| Cypriots | 100.0 /100 | #12 | Exceptional $127,064 |
| Immigrants | Australia | 100.0 /100 | #13 | Exceptional $126,620 |
| Immigrants | South Central Asia | 100.0 /100 | #14 | Exceptional $125,956 |
| Eastern Europeans | 100.0 /100 | #15 | Exceptional $125,546 |