Immigrants from South Eastern Asia vs Iranian Median Family Income
COMPARE
Immigrants from South Eastern Asia
Iranian
Median Family Income
Median Family Income Comparison
Immigrants from South Eastern Asia
Iranians
$106,252
MEDIAN FAMILY INCOME
86.1/ 100
METRIC RATING
136th/ 347
METRIC RANK
$133,839
MEDIAN FAMILY INCOME
100.0/ 100
METRIC RATING
5th/ 347
METRIC RANK
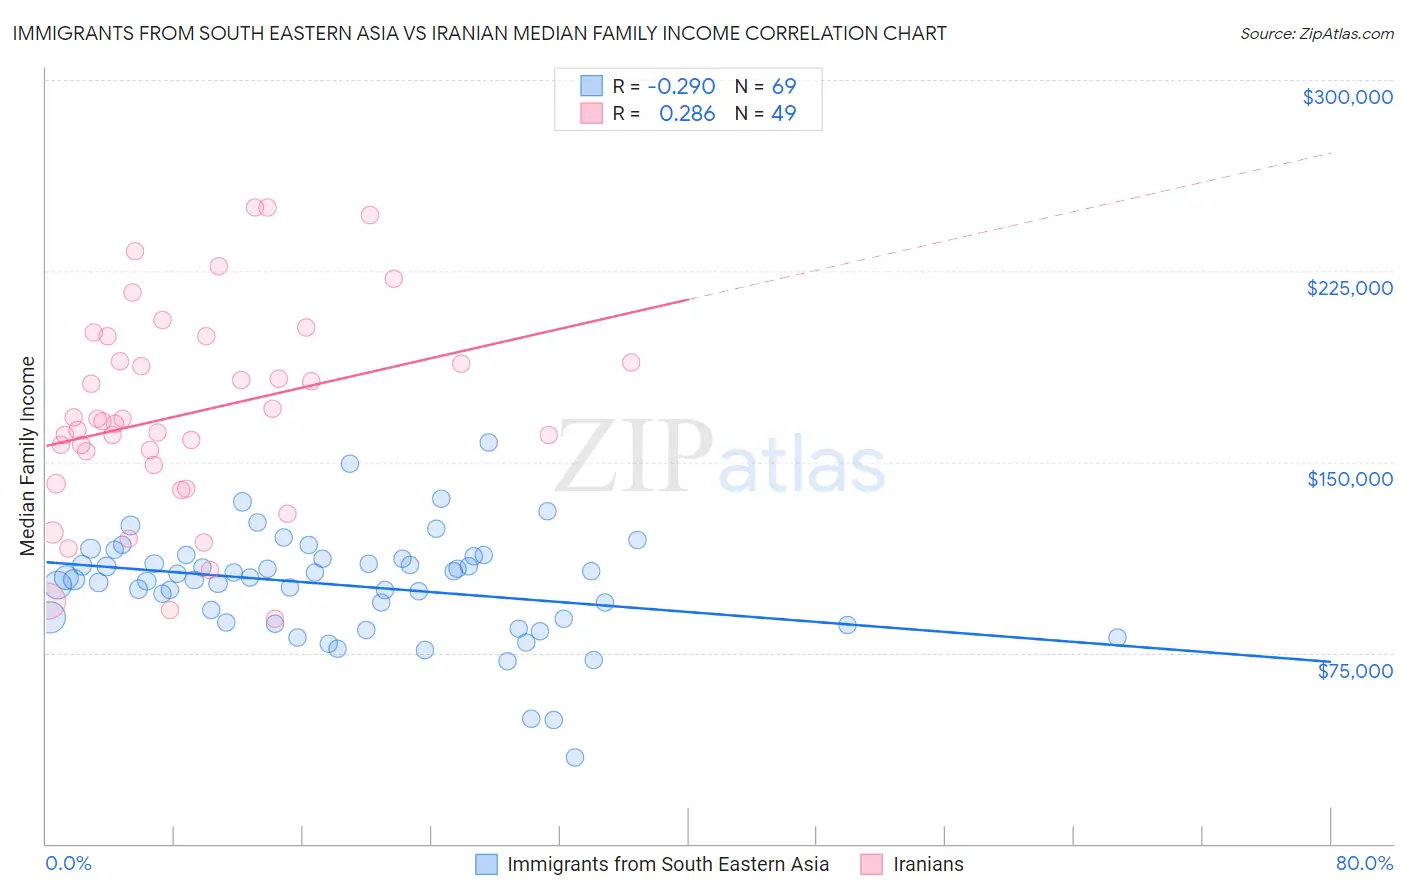
Immigrants from South Eastern Asia vs Iranian Median Family Income Correlation Chart
The statistical analysis conducted on geographies consisting of 511,889,234 people shows a weak negative correlation between the proportion of Immigrants from South Eastern Asia and median family income in the United States with a correlation coefficient (R) of -0.290 and weighted average of $106,252. Similarly, the statistical analysis conducted on geographies consisting of 316,569,365 people shows a weak positive correlation between the proportion of Iranians and median family income in the United States with a correlation coefficient (R) of 0.286 and weighted average of $133,839, a difference of 26.0%.
Median Family Income Correlation Summary
| Measurement | Immigrants from South Eastern Asia | Iranian |
| Minimum | $34,076 | $88,250 |
| Maximum | $157,444 | $250,001 |
| Range | $123,368 | $161,751 |
| Mean | $101,571 | $169,044 |
| Median | $104,465 | $166,027 |
| Interquartile 25% (IQ1) | $87,571 | $144,981 |
| Interquartile 75% (IQ3) | $112,620 | $194,217 |
| Interquartile Range (IQR) | $25,049 | $49,236 |
| Standard Deviation (Sample) | $21,051 | $39,948 |
| Standard Deviation (Population) | $20,898 | $39,538 |
Similar Demographics by Median Family Income
Demographics Similar to Immigrants from South Eastern Asia by Median Family Income
In terms of median family income, the demographic groups most similar to Immigrants from South Eastern Asia are Portuguese ($106,286, a difference of 0.030%), Immigrants from Uganda ($106,188, a difference of 0.060%), Immigrants from Vietnam ($106,186, a difference of 0.060%), Luxembourger ($106,183, a difference of 0.060%), and Norwegian ($106,144, a difference of 0.10%).
| Demographics | Rating | Rank | Median Family Income |
| Arabs | 89.9 /100 | #129 | Excellent $106,952 |
| Brazilians | 89.8 /100 | #130 | Excellent $106,942 |
| Canadians | 88.1 /100 | #131 | Excellent $106,597 |
| Immigrants | Fiji | 87.8 /100 | #132 | Excellent $106,544 |
| Ugandans | 87.8 /100 | #133 | Excellent $106,541 |
| Immigrants | Oceania | 87.3 /100 | #134 | Excellent $106,453 |
| Portuguese | 86.3 /100 | #135 | Excellent $106,286 |
| Immigrants | South Eastern Asia | 86.1 /100 | #136 | Excellent $106,252 |
| Immigrants | Uganda | 85.7 /100 | #137 | Excellent $106,188 |
| Immigrants | Vietnam | 85.7 /100 | #138 | Excellent $106,186 |
| Luxembourgers | 85.7 /100 | #139 | Excellent $106,183 |
| Norwegians | 85.5 /100 | #140 | Excellent $106,144 |
| Immigrants | Syria | 85.3 /100 | #141 | Excellent $106,118 |
| Slovenes | 84.7 /100 | #142 | Excellent $106,020 |
| Tongans | 84.3 /100 | #143 | Excellent $105,967 |
Demographics Similar to Iranians by Median Family Income
In terms of median family income, the demographic groups most similar to Iranians are Immigrants from India ($134,028, a difference of 0.14%), Immigrants from Singapore ($134,818, a difference of 0.73%), Thai ($131,281, a difference of 1.9%), Immigrants from Hong Kong ($131,067, a difference of 2.1%), and Immigrants from Iran ($130,894, a difference of 2.2%).
| Demographics | Rating | Rank | Median Family Income |
| Filipinos | 100.0 /100 | #1 | Exceptional $138,397 |
| Immigrants | Taiwan | 100.0 /100 | #2 | Exceptional $136,949 |
| Immigrants | Singapore | 100.0 /100 | #3 | Exceptional $134,818 |
| Immigrants | India | 100.0 /100 | #4 | Exceptional $134,028 |
| Iranians | 100.0 /100 | #5 | Exceptional $133,839 |
| Thais | 100.0 /100 | #6 | Exceptional $131,281 |
| Immigrants | Hong Kong | 100.0 /100 | #7 | Exceptional $131,067 |
| Immigrants | Iran | 100.0 /100 | #8 | Exceptional $130,894 |
| Okinawans | 100.0 /100 | #9 | Exceptional $129,979 |
| Immigrants | Ireland | 100.0 /100 | #10 | Exceptional $127,584 |
| Immigrants | Israel | 100.0 /100 | #11 | Exceptional $127,430 |
| Cypriots | 100.0 /100 | #12 | Exceptional $127,064 |
| Immigrants | Australia | 100.0 /100 | #13 | Exceptional $126,620 |
| Immigrants | South Central Asia | 100.0 /100 | #14 | Exceptional $125,956 |
| Eastern Europeans | 100.0 /100 | #15 | Exceptional $125,546 |