Ugandan vs Immigrants from Zaire Median Earnings
COMPARE
Ugandan
Immigrants from Zaire
Median Earnings
Median Earnings Comparison
Ugandans
Immigrants from Zaire
$47,854
MEDIAN EARNINGS
88.0/ 100
METRIC RATING
142nd/ 347
METRIC RANK
$41,325
MEDIAN EARNINGS
0.1/ 100
METRIC RATING
293rd/ 347
METRIC RANK
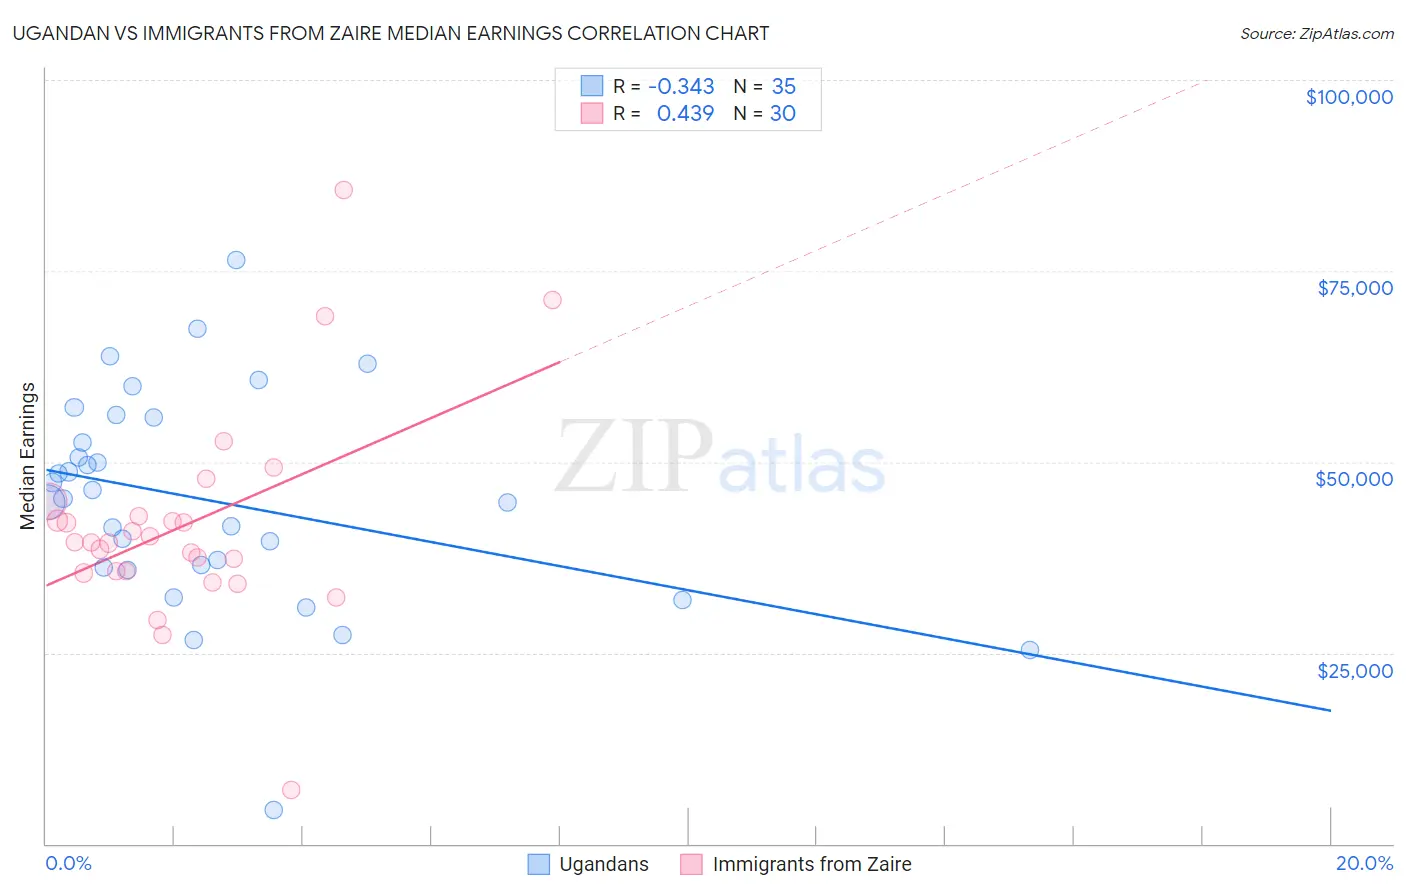
Ugandan vs Immigrants from Zaire Median Earnings Correlation Chart
The statistical analysis conducted on geographies consisting of 94,012,409 people shows a mild negative correlation between the proportion of Ugandans and median earnings in the United States with a correlation coefficient (R) of -0.343 and weighted average of $47,854. Similarly, the statistical analysis conducted on geographies consisting of 107,255,584 people shows a moderate positive correlation between the proportion of Immigrants from Zaire and median earnings in the United States with a correlation coefficient (R) of 0.439 and weighted average of $41,325, a difference of 15.8%.
Median Earnings Correlation Summary
| Measurement | Ugandan | Immigrants from Zaire |
| Minimum | $4,426 | $7,065 |
| Maximum | $76,513 | $85,536 |
| Range | $72,087 | $78,471 |
| Mean | $45,002 | $41,788 |
| Median | $45,167 | $39,475 |
| Interquartile 25% (IQ1) | $36,215 | $35,616 |
| Interquartile 75% (IQ3) | $55,750 | $42,826 |
| Interquartile Range (IQR) | $19,535 | $7,210 |
| Standard Deviation (Sample) | $14,118 | $14,049 |
| Standard Deviation (Population) | $13,915 | $13,813 |
Similar Demographics by Median Earnings
Demographics Similar to Ugandans by Median Earnings
In terms of median earnings, the demographic groups most similar to Ugandans are Swedish ($47,851, a difference of 0.010%), Immigrants from Sierra Leone ($47,875, a difference of 0.040%), Taiwanese ($47,902, a difference of 0.10%), Canadian ($47,911, a difference of 0.12%), and Hungarian ($47,795, a difference of 0.12%).
| Demographics | Rating | Rank | Median Earnings |
| Portuguese | 90.4 /100 | #135 | Exceptional $48,032 |
| Slovenes | 90.0 /100 | #136 | Excellent $47,995 |
| Immigrants | Nepal | 89.0 /100 | #137 | Excellent $47,925 |
| Europeans | 88.9 /100 | #138 | Excellent $47,915 |
| Canadians | 88.8 /100 | #139 | Excellent $47,911 |
| Taiwanese | 88.7 /100 | #140 | Excellent $47,902 |
| Immigrants | Sierra Leone | 88.3 /100 | #141 | Excellent $47,875 |
| Ugandans | 88.0 /100 | #142 | Excellent $47,854 |
| Swedes | 88.0 /100 | #143 | Excellent $47,851 |
| Hungarians | 87.1 /100 | #144 | Excellent $47,795 |
| Immigrants | Saudi Arabia | 85.6 /100 | #145 | Excellent $47,704 |
| Immigrants | Chile | 85.5 /100 | #146 | Excellent $47,697 |
| Immigrants | South Eastern Asia | 85.0 /100 | #147 | Excellent $47,671 |
| Immigrants | Eritrea | 84.8 /100 | #148 | Excellent $47,657 |
| Luxembourgers | 84.5 /100 | #149 | Excellent $47,640 |
Demographics Similar to Immigrants from Zaire by Median Earnings
In terms of median earnings, the demographic groups most similar to Immigrants from Zaire are Potawatomi ($41,288, a difference of 0.090%), Bangladeshi ($41,263, a difference of 0.15%), Cherokee ($41,252, a difference of 0.18%), Guatemalan ($41,205, a difference of 0.29%), and U.S. Virgin Islander ($41,448, a difference of 0.30%).
| Demographics | Rating | Rank | Median Earnings |
| Mexican American Indians | 0.1 /100 | #286 | Tragic $41,719 |
| Indonesians | 0.1 /100 | #287 | Tragic $41,701 |
| Immigrants | Dominican Republic | 0.1 /100 | #288 | Tragic $41,554 |
| Comanche | 0.1 /100 | #289 | Tragic $41,519 |
| Paiute | 0.1 /100 | #290 | Tragic $41,508 |
| Central American Indians | 0.1 /100 | #291 | Tragic $41,474 |
| U.S. Virgin Islanders | 0.1 /100 | #292 | Tragic $41,448 |
| Immigrants | Zaire | 0.1 /100 | #293 | Tragic $41,325 |
| Potawatomi | 0.1 /100 | #294 | Tragic $41,288 |
| Bangladeshis | 0.1 /100 | #295 | Tragic $41,263 |
| Cherokee | 0.1 /100 | #296 | Tragic $41,252 |
| Guatemalans | 0.1 /100 | #297 | Tragic $41,205 |
| Immigrants | Micronesia | 0.1 /100 | #298 | Tragic $41,133 |
| Immigrants | Caribbean | 0.1 /100 | #299 | Tragic $41,119 |
| Ute | 0.1 /100 | #300 | Tragic $41,051 |