Romanian vs Austrian Median Earnings
COMPARE
Romanian
Austrian
Median Earnings
Median Earnings Comparison
Romanians
Austrians
$50,244
MEDIAN EARNINGS
99.5/ 100
METRIC RATING
83rd/ 347
METRIC RANK
$49,501
MEDIAN EARNINGS
98.7/ 100
METRIC RATING
103rd/ 347
METRIC RANK
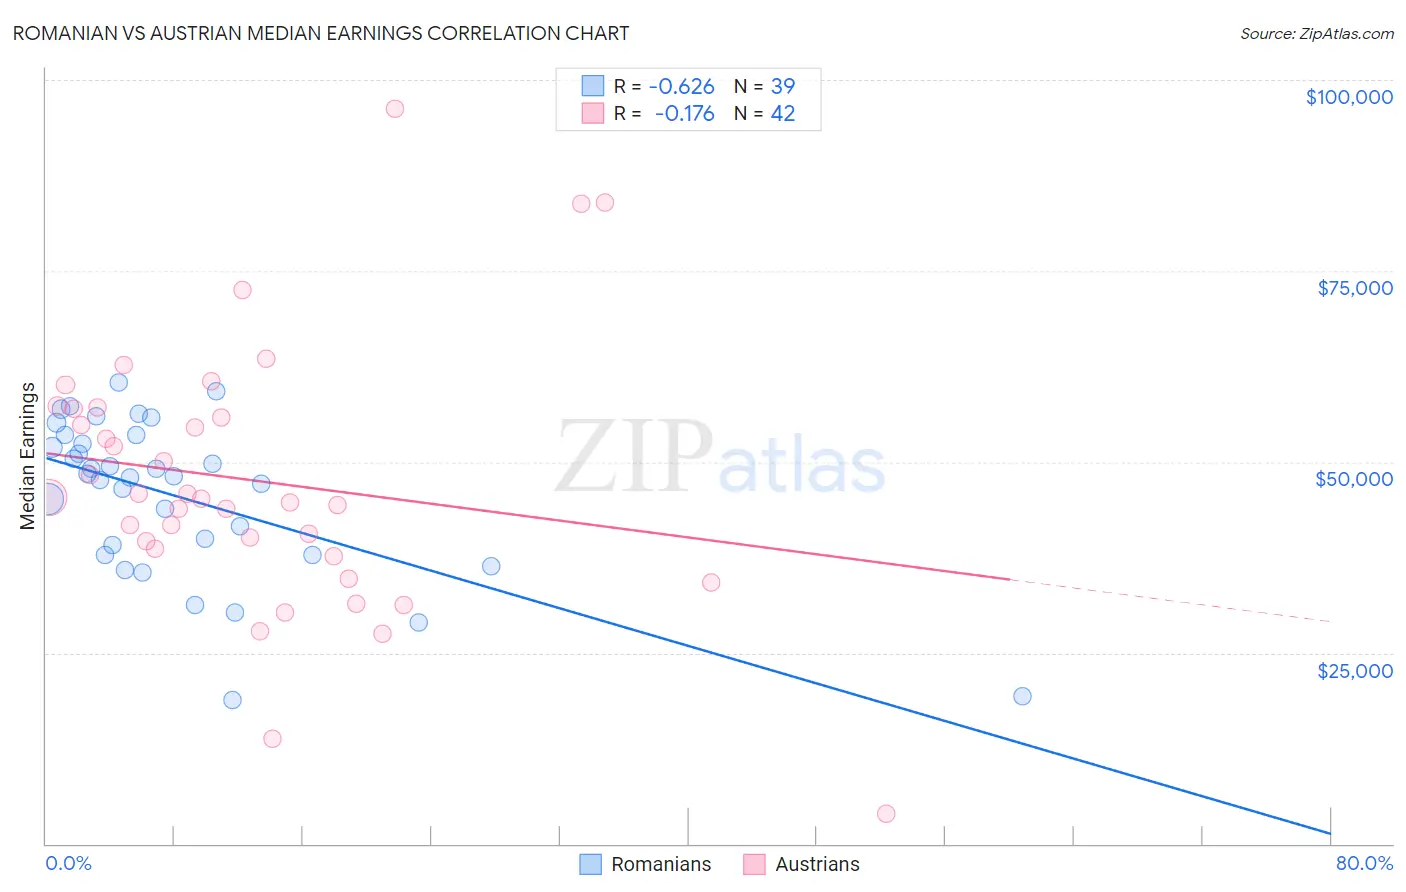
Romanian vs Austrian Median Earnings Correlation Chart
The statistical analysis conducted on geographies consisting of 377,906,078 people shows a significant negative correlation between the proportion of Romanians and median earnings in the United States with a correlation coefficient (R) of -0.626 and weighted average of $50,244. Similarly, the statistical analysis conducted on geographies consisting of 452,042,983 people shows a poor negative correlation between the proportion of Austrians and median earnings in the United States with a correlation coefficient (R) of -0.176 and weighted average of $49,501, a difference of 1.5%.
Median Earnings Correlation Summary
| Measurement | Romanian | Austrian |
| Minimum | $18,814 | $3,902 |
| Maximum | $60,367 | $96,250 |
| Range | $41,553 | $92,348 |
| Mean | $45,500 | $47,542 |
| Median | $48,068 | $45,255 |
| Interquartile 25% (IQ1) | $37,750 | $38,609 |
| Interquartile 75% (IQ3) | $53,505 | $56,967 |
| Interquartile Range (IQR) | $15,755 | $18,358 |
| Standard Deviation (Sample) | $10,336 | $17,409 |
| Standard Deviation (Population) | $10,203 | $17,200 |
Demographics Similar to Romanians and Austrians by Median Earnings
In terms of median earnings, the demographic groups most similar to Romanians are Immigrants from Hungary ($50,227, a difference of 0.030%), Immigrants from Kazakhstan ($50,225, a difference of 0.040%), Immigrants from Canada ($50,192, a difference of 0.10%), Immigrants from Uzbekistan ($50,151, a difference of 0.19%), and Albanian ($50,116, a difference of 0.25%). Similarly, the demographic groups most similar to Austrians are Ethiopian ($49,572, a difference of 0.14%), Immigrants from Poland ($49,633, a difference of 0.27%), Jordanian ($49,632, a difference of 0.27%), Immigrants from Afghanistan ($49,645, a difference of 0.29%), and Immigrants from Northern Africa ($49,648, a difference of 0.30%).
| Demographics | Rating | Rank | Median Earnings |
| Romanians | 99.5 /100 | #83 | Exceptional $50,244 |
| Immigrants | Hungary | 99.5 /100 | #84 | Exceptional $50,227 |
| Immigrants | Kazakhstan | 99.5 /100 | #85 | Exceptional $50,225 |
| Immigrants | Canada | 99.5 /100 | #86 | Exceptional $50,192 |
| Immigrants | Uzbekistan | 99.5 /100 | #87 | Exceptional $50,151 |
| Albanians | 99.4 /100 | #88 | Exceptional $50,116 |
| Immigrants | North America | 99.4 /100 | #89 | Exceptional $50,108 |
| Italians | 99.3 /100 | #90 | Exceptional $49,915 |
| Macedonians | 99.2 /100 | #91 | Exceptional $49,893 |
| Immigrants | Argentina | 99.2 /100 | #92 | Exceptional $49,841 |
| Armenians | 99.1 /100 | #93 | Exceptional $49,804 |
| Croatians | 99.0 /100 | #94 | Exceptional $49,724 |
| Immigrants | England | 99.0 /100 | #95 | Exceptional $49,722 |
| Immigrants | Lebanon | 99.0 /100 | #96 | Exceptional $49,682 |
| Immigrants | North Macedonia | 98.9 /100 | #97 | Exceptional $49,658 |
| Immigrants | Northern Africa | 98.9 /100 | #98 | Exceptional $49,648 |
| Immigrants | Afghanistan | 98.9 /100 | #99 | Exceptional $49,645 |
| Immigrants | Poland | 98.9 /100 | #100 | Exceptional $49,633 |
| Jordanians | 98.9 /100 | #101 | Exceptional $49,632 |
| Ethiopians | 98.8 /100 | #102 | Exceptional $49,572 |
| Austrians | 98.7 /100 | #103 | Exceptional $49,501 |