Immigrants from the Azores vs Immigrants from Zaire Median Earnings
COMPARE
Immigrants from the Azores
Immigrants from Zaire
Median Earnings
Median Earnings Comparison
Immigrants from the Azores
Immigrants from Zaire
$45,812
MEDIAN EARNINGS
29.5/ 100
METRIC RATING
200th/ 347
METRIC RANK
$41,325
MEDIAN EARNINGS
0.1/ 100
METRIC RATING
293rd/ 347
METRIC RANK
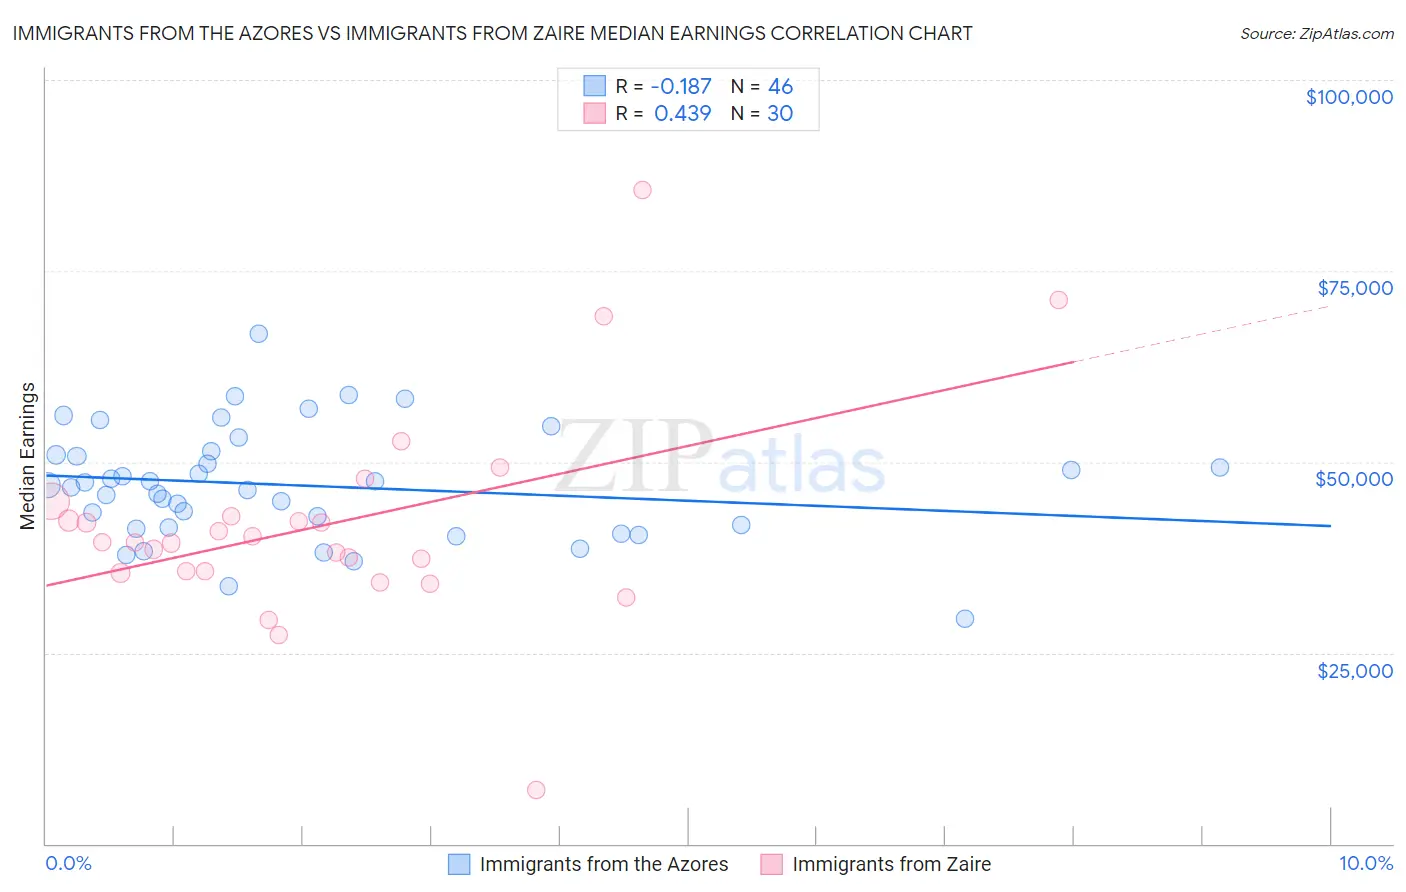
Immigrants from the Azores vs Immigrants from Zaire Median Earnings Correlation Chart
The statistical analysis conducted on geographies consisting of 46,253,253 people shows a poor negative correlation between the proportion of Immigrants from the Azores and median earnings in the United States with a correlation coefficient (R) of -0.187 and weighted average of $45,812. Similarly, the statistical analysis conducted on geographies consisting of 107,255,584 people shows a moderate positive correlation between the proportion of Immigrants from Zaire and median earnings in the United States with a correlation coefficient (R) of 0.439 and weighted average of $41,325, a difference of 10.9%.
Median Earnings Correlation Summary
| Measurement | Immigrants from the Azores | Immigrants from Zaire |
| Minimum | $29,500 | $7,065 |
| Maximum | $66,731 | $85,536 |
| Range | $37,231 | $78,471 |
| Mean | $46,892 | $41,788 |
| Median | $46,853 | $39,475 |
| Interquartile 25% (IQ1) | $41,350 | $35,616 |
| Interquartile 75% (IQ3) | $50,852 | $42,826 |
| Interquartile Range (IQR) | $9,501 | $7,210 |
| Standard Deviation (Sample) | $7,383 | $14,049 |
| Standard Deviation (Population) | $7,302 | $13,813 |
Similar Demographics by Median Earnings
Demographics Similar to Immigrants from the Azores by Median Earnings
In terms of median earnings, the demographic groups most similar to Immigrants from the Azores are Immigrants from Barbados ($45,816, a difference of 0.010%), Trinidadian and Tobagonian ($45,820, a difference of 0.020%), Yugoslavian ($45,846, a difference of 0.070%), Barbadian ($45,846, a difference of 0.070%), and Celtic ($45,732, a difference of 0.18%).
| Demographics | Rating | Rank | Median Earnings |
| Guamanians/Chamorros | 33.2 /100 | #193 | Fair $45,933 |
| Immigrants | Costa Rica | 33.0 /100 | #194 | Fair $45,928 |
| Immigrants | St. Vincent and the Grenadines | 32.4 /100 | #195 | Fair $45,908 |
| Yugoslavians | 30.5 /100 | #196 | Fair $45,846 |
| Barbadians | 30.5 /100 | #197 | Fair $45,846 |
| Trinidadians and Tobagonians | 29.7 /100 | #198 | Fair $45,820 |
| Immigrants | Barbados | 29.6 /100 | #199 | Fair $45,816 |
| Immigrants | Azores | 29.5 /100 | #200 | Fair $45,812 |
| Celtics | 27.2 /100 | #201 | Fair $45,732 |
| Immigrants | Trinidad and Tobago | 27.1 /100 | #202 | Fair $45,729 |
| Welsh | 26.6 /100 | #203 | Fair $45,710 |
| Immigrants | Uruguay | 25.9 /100 | #204 | Fair $45,682 |
| Tongans | 25.4 /100 | #205 | Fair $45,665 |
| Immigrants | Ghana | 24.8 /100 | #206 | Fair $45,641 |
| Immigrants | Senegal | 24.0 /100 | #207 | Fair $45,611 |
Demographics Similar to Immigrants from Zaire by Median Earnings
In terms of median earnings, the demographic groups most similar to Immigrants from Zaire are Potawatomi ($41,288, a difference of 0.090%), Bangladeshi ($41,263, a difference of 0.15%), Cherokee ($41,252, a difference of 0.18%), Guatemalan ($41,205, a difference of 0.29%), and U.S. Virgin Islander ($41,448, a difference of 0.30%).
| Demographics | Rating | Rank | Median Earnings |
| Mexican American Indians | 0.1 /100 | #286 | Tragic $41,719 |
| Indonesians | 0.1 /100 | #287 | Tragic $41,701 |
| Immigrants | Dominican Republic | 0.1 /100 | #288 | Tragic $41,554 |
| Comanche | 0.1 /100 | #289 | Tragic $41,519 |
| Paiute | 0.1 /100 | #290 | Tragic $41,508 |
| Central American Indians | 0.1 /100 | #291 | Tragic $41,474 |
| U.S. Virgin Islanders | 0.1 /100 | #292 | Tragic $41,448 |
| Immigrants | Zaire | 0.1 /100 | #293 | Tragic $41,325 |
| Potawatomi | 0.1 /100 | #294 | Tragic $41,288 |
| Bangladeshis | 0.1 /100 | #295 | Tragic $41,263 |
| Cherokee | 0.1 /100 | #296 | Tragic $41,252 |
| Guatemalans | 0.1 /100 | #297 | Tragic $41,205 |
| Immigrants | Micronesia | 0.1 /100 | #298 | Tragic $41,133 |
| Immigrants | Caribbean | 0.1 /100 | #299 | Tragic $41,119 |
| Ute | 0.1 /100 | #300 | Tragic $41,051 |