African vs Immigrants from Zaire Median Earnings
COMPARE
African
Immigrants from Zaire
Median Earnings
Median Earnings Comparison
Africans
Immigrants from Zaire
$41,955
MEDIAN EARNINGS
0.2/ 100
METRIC RATING
282nd/ 347
METRIC RANK
$41,325
MEDIAN EARNINGS
0.1/ 100
METRIC RATING
293rd/ 347
METRIC RANK
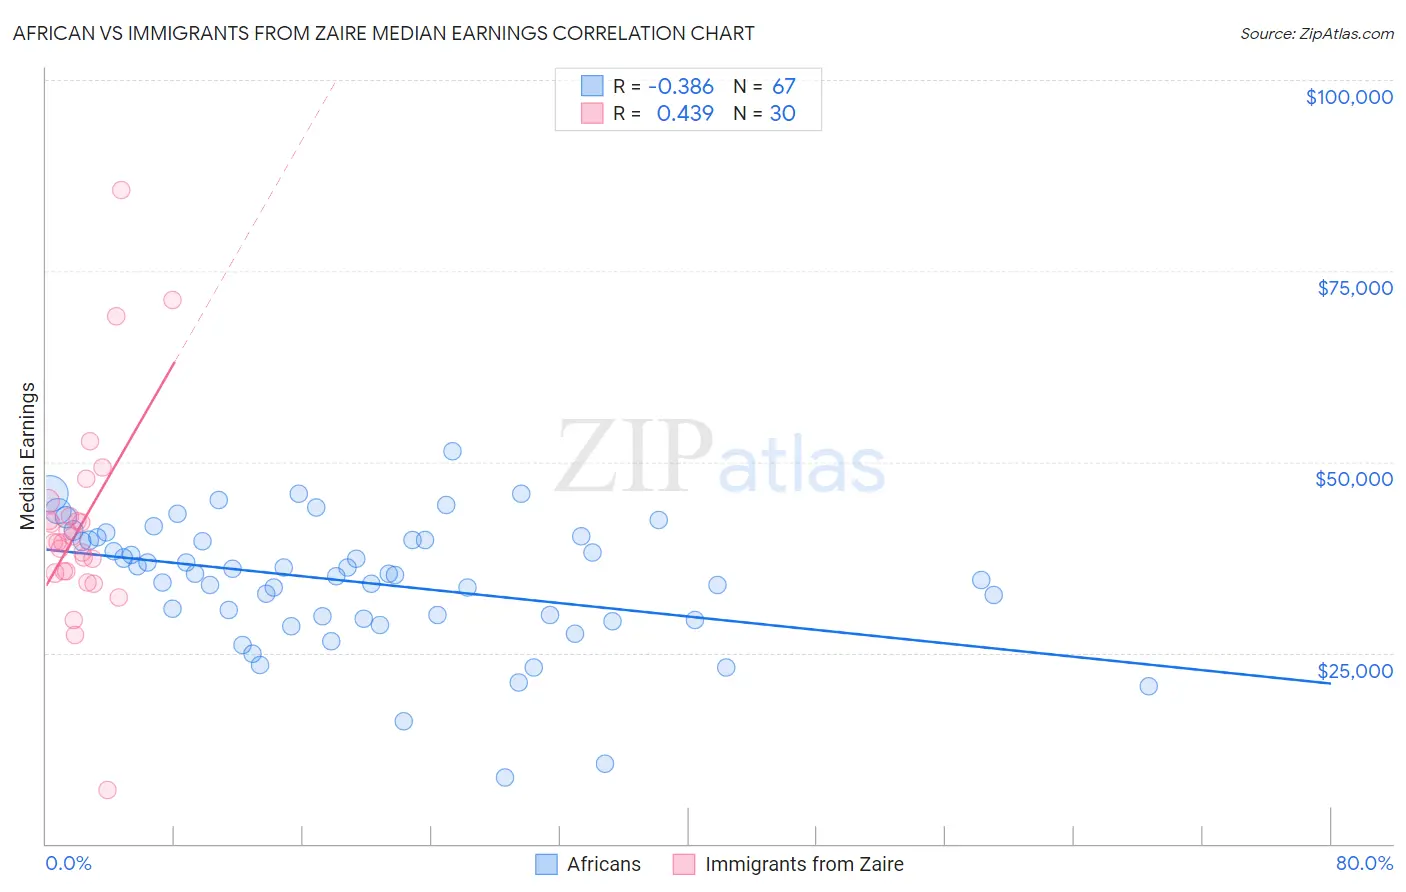
African vs Immigrants from Zaire Median Earnings Correlation Chart
The statistical analysis conducted on geographies consisting of 470,066,359 people shows a mild negative correlation between the proportion of Africans and median earnings in the United States with a correlation coefficient (R) of -0.386 and weighted average of $41,955. Similarly, the statistical analysis conducted on geographies consisting of 107,255,584 people shows a moderate positive correlation between the proportion of Immigrants from Zaire and median earnings in the United States with a correlation coefficient (R) of 0.439 and weighted average of $41,325, a difference of 1.5%.
Median Earnings Correlation Summary
| Measurement | African | Immigrants from Zaire |
| Minimum | $8,672 | $7,065 |
| Maximum | $51,324 | $85,536 |
| Range | $42,652 | $78,471 |
| Mean | $34,249 | $41,788 |
| Median | $35,314 | $39,475 |
| Interquartile 25% (IQ1) | $29,519 | $35,616 |
| Interquartile 75% (IQ3) | $39,743 | $42,826 |
| Interquartile Range (IQR) | $10,224 | $7,210 |
| Standard Deviation (Sample) | $8,278 | $14,049 |
| Standard Deviation (Population) | $8,216 | $13,813 |
Demographics Similar to Africans and Immigrants from Zaire by Median Earnings
In terms of median earnings, the demographic groups most similar to Africans are Marshallese ($41,969, a difference of 0.030%), Dominican ($41,864, a difference of 0.22%), Blackfeet ($41,822, a difference of 0.32%), Hmong ($42,111, a difference of 0.37%), and Colville ($42,151, a difference of 0.47%). Similarly, the demographic groups most similar to Immigrants from Zaire are Potawatomi ($41,288, a difference of 0.090%), Bangladeshi ($41,263, a difference of 0.15%), Cherokee ($41,252, a difference of 0.18%), Guatemalan ($41,205, a difference of 0.29%), and U.S. Virgin Islander ($41,448, a difference of 0.30%).
| Demographics | Rating | Rank | Median Earnings |
| Central Americans | 0.3 /100 | #277 | Tragic $42,280 |
| Cajuns | 0.3 /100 | #278 | Tragic $42,189 |
| Colville | 0.2 /100 | #279 | Tragic $42,151 |
| Hmong | 0.2 /100 | #280 | Tragic $42,111 |
| Marshallese | 0.2 /100 | #281 | Tragic $41,969 |
| Africans | 0.2 /100 | #282 | Tragic $41,955 |
| Dominicans | 0.2 /100 | #283 | Tragic $41,864 |
| Blackfeet | 0.2 /100 | #284 | Tragic $41,822 |
| Immigrants | Nicaragua | 0.1 /100 | #285 | Tragic $41,737 |
| Mexican American Indians | 0.1 /100 | #286 | Tragic $41,719 |
| Indonesians | 0.1 /100 | #287 | Tragic $41,701 |
| Immigrants | Dominican Republic | 0.1 /100 | #288 | Tragic $41,554 |
| Comanche | 0.1 /100 | #289 | Tragic $41,519 |
| Paiute | 0.1 /100 | #290 | Tragic $41,508 |
| Central American Indians | 0.1 /100 | #291 | Tragic $41,474 |
| U.S. Virgin Islanders | 0.1 /100 | #292 | Tragic $41,448 |
| Immigrants | Zaire | 0.1 /100 | #293 | Tragic $41,325 |
| Potawatomi | 0.1 /100 | #294 | Tragic $41,288 |
| Bangladeshis | 0.1 /100 | #295 | Tragic $41,263 |
| Cherokee | 0.1 /100 | #296 | Tragic $41,252 |
| Guatemalans | 0.1 /100 | #297 | Tragic $41,205 |