Potawatomi vs Immigrants from Taiwan Professional Degree
COMPARE
Potawatomi
Immigrants from Taiwan
Professional Degree
Professional Degree Comparison
Potawatomi
Immigrants from Taiwan
3.6%
PROFESSIONAL DEGREE
0.5/ 100
METRIC RATING
274th/ 347
METRIC RANK
7.1%
PROFESSIONAL DEGREE
100.0/ 100
METRIC RATING
9th/ 347
METRIC RANK
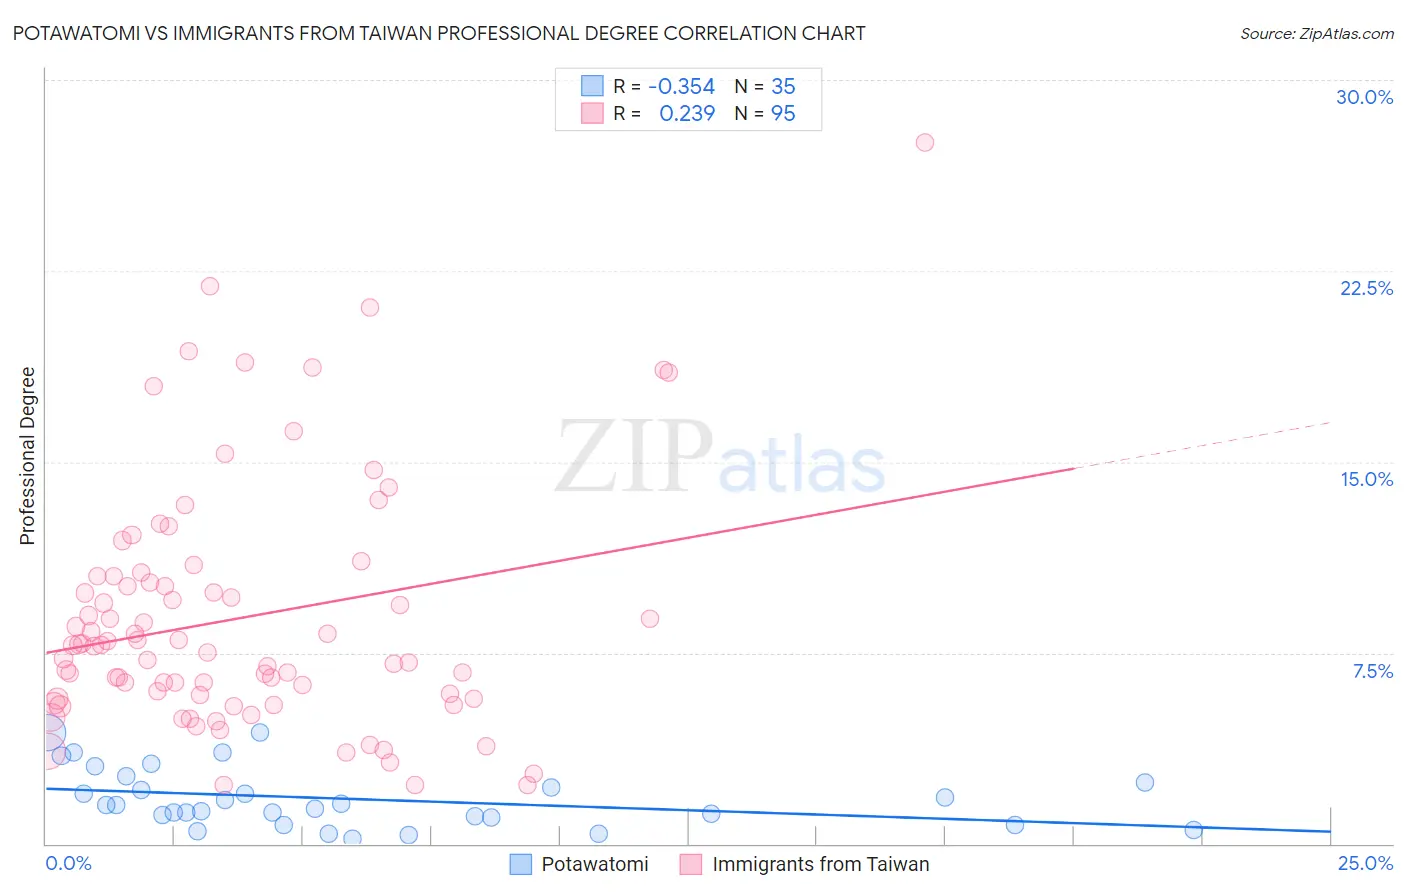
Potawatomi vs Immigrants from Taiwan Professional Degree Correlation Chart
The statistical analysis conducted on geographies consisting of 117,535,348 people shows a mild negative correlation between the proportion of Potawatomi and percentage of population with at least professional degree education in the United States with a correlation coefficient (R) of -0.354 and weighted average of 3.6%. Similarly, the statistical analysis conducted on geographies consisting of 298,058,509 people shows a weak positive correlation between the proportion of Immigrants from Taiwan and percentage of population with at least professional degree education in the United States with a correlation coefficient (R) of 0.239 and weighted average of 7.1%, a difference of 98.6%.
Professional Degree Correlation Summary
| Measurement | Potawatomi | Immigrants from Taiwan |
| Minimum | 0.21% | 2.3% |
| Maximum | 4.4% | 27.6% |
| Range | 4.2% | 25.2% |
| Mean | 1.8% | 8.9% |
| Median | 1.5% | 7.8% |
| Interquartile 25% (IQ1) | 1.0% | 5.7% |
| Interquartile 75% (IQ3) | 2.4% | 10.5% |
| Interquartile Range (IQR) | 1.4% | 4.8% |
| Standard Deviation (Sample) | 1.1% | 4.8% |
| Standard Deviation (Population) | 1.1% | 4.8% |
Similar Demographics by Professional Degree
Demographics Similar to Potawatomi by Professional Degree
In terms of professional degree, the demographic groups most similar to Potawatomi are American (3.6%, a difference of 0.13%), Immigrants from Jamaica (3.6%, a difference of 0.19%), Belizean (3.6%, a difference of 0.22%), Immigrants from Dominica (3.6%, a difference of 0.23%), and Liberian (3.6%, a difference of 0.27%).
| Demographics | Rating | Rank | Professional Degree |
| Delaware | 0.7 /100 | #267 | Tragic 3.6% |
| Aleuts | 0.7 /100 | #268 | Tragic 3.6% |
| Immigrants | Cuba | 0.6 /100 | #269 | Tragic 3.6% |
| Central Americans | 0.6 /100 | #270 | Tragic 3.6% |
| Belizeans | 0.5 /100 | #271 | Tragic 3.6% |
| Immigrants | Jamaica | 0.5 /100 | #272 | Tragic 3.6% |
| Americans | 0.5 /100 | #273 | Tragic 3.6% |
| Potawatomi | 0.5 /100 | #274 | Tragic 3.6% |
| Immigrants | Dominica | 0.5 /100 | #275 | Tragic 3.6% |
| Liberians | 0.5 /100 | #276 | Tragic 3.6% |
| Cheyenne | 0.5 /100 | #277 | Tragic 3.6% |
| Japanese | 0.5 /100 | #278 | Tragic 3.5% |
| Immigrants | Portugal | 0.5 /100 | #279 | Tragic 3.5% |
| Dominicans | 0.5 /100 | #280 | Tragic 3.5% |
| Apache | 0.5 /100 | #281 | Tragic 3.5% |
Demographics Similar to Immigrants from Taiwan by Professional Degree
In terms of professional degree, the demographic groups most similar to Immigrants from Taiwan are Immigrants from Switzerland (7.1%, a difference of 0.19%), Eastern European (7.1%, a difference of 0.33%), Immigrants from Belgium (7.0%, a difference of 1.7%), Cypriot (6.9%, a difference of 1.9%), and Israeli (6.9%, a difference of 2.0%).
| Demographics | Rating | Rank | Professional Degree |
| Immigrants | Singapore | 100.0 /100 | #2 | Exceptional 7.7% |
| Iranians | 100.0 /100 | #3 | Exceptional 7.6% |
| Filipinos | 100.0 /100 | #4 | Exceptional 7.6% |
| Immigrants | Iran | 100.0 /100 | #5 | Exceptional 7.3% |
| Okinawans | 100.0 /100 | #6 | Exceptional 7.3% |
| Eastern Europeans | 100.0 /100 | #7 | Exceptional 7.1% |
| Immigrants | Switzerland | 100.0 /100 | #8 | Exceptional 7.1% |
| Immigrants | Taiwan | 100.0 /100 | #9 | Exceptional 7.1% |
| Immigrants | Belgium | 100.0 /100 | #10 | Exceptional 7.0% |
| Cypriots | 100.0 /100 | #11 | Exceptional 6.9% |
| Israelis | 100.0 /100 | #12 | Exceptional 6.9% |
| Immigrants | Australia | 100.0 /100 | #13 | Exceptional 6.9% |
| Immigrants | France | 100.0 /100 | #14 | Exceptional 6.8% |
| Immigrants | China | 100.0 /100 | #15 | Exceptional 6.7% |
| Immigrants | Sweden | 100.0 /100 | #16 | Exceptional 6.7% |