Immigrants from Sweden vs Immigrants from Taiwan Median Male Earnings
COMPARE
Immigrants from Sweden
Immigrants from Taiwan
Median Male Earnings
Median Male Earnings Comparison
Immigrants from Sweden
Immigrants from Taiwan
$65,406
MEDIAN MALE EARNINGS
100.0/ 100
METRIC RATING
21st/ 347
METRIC RANK
$74,031
MEDIAN MALE EARNINGS
100.0/ 100
METRIC RATING
3rd/ 347
METRIC RANK
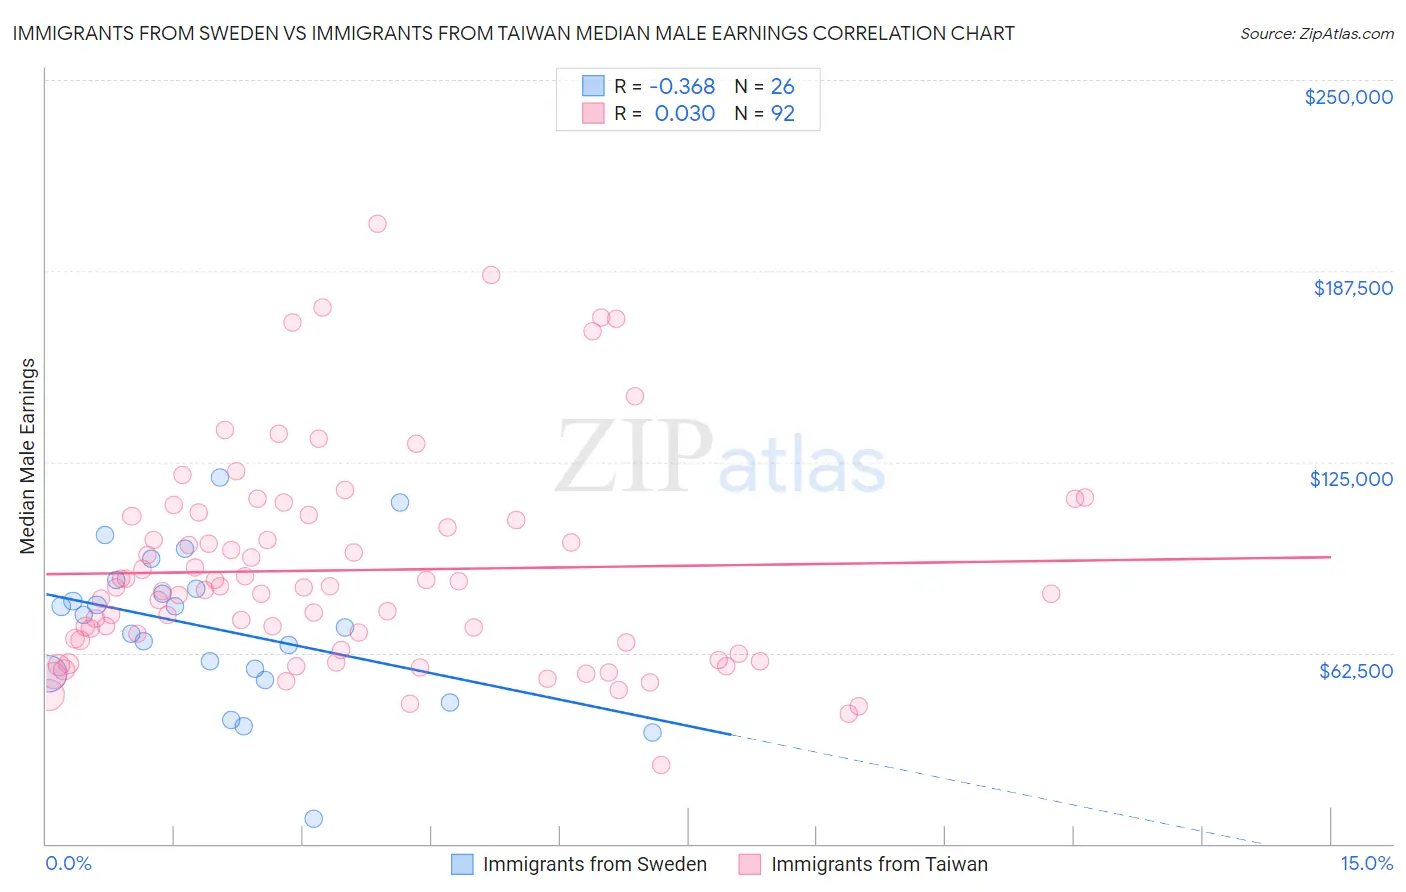
Immigrants from Sweden vs Immigrants from Taiwan Median Male Earnings Correlation Chart
The statistical analysis conducted on geographies consisting of 164,719,286 people shows a mild negative correlation between the proportion of Immigrants from Sweden and median male earnings in the United States with a correlation coefficient (R) of -0.368 and weighted average of $65,406. Similarly, the statistical analysis conducted on geographies consisting of 298,261,380 people shows no correlation between the proportion of Immigrants from Taiwan and median male earnings in the United States with a correlation coefficient (R) of 0.030 and weighted average of $74,031, a difference of 13.2%.
Median Male Earnings Correlation Summary
| Measurement | Immigrants from Sweden | Immigrants from Taiwan |
| Minimum | $8,107 | $25,921 |
| Maximum | $119,732 | $202,837 |
| Range | $111,625 | $176,916 |
| Mean | $70,306 | $89,558 |
| Median | $72,770 | $83,311 |
| Interquartile 25% (IQ1) | $55,777 | $64,686 |
| Interquartile 75% (IQ3) | $83,429 | $106,599 |
| Interquartile Range (IQR) | $27,652 | $41,914 |
| Standard Deviation (Sample) | $24,867 | $34,934 |
| Standard Deviation (Population) | $24,384 | $34,744 |
Demographics Similar to Immigrants from Sweden and Immigrants from Taiwan by Median Male Earnings
In terms of median male earnings, the demographic groups most similar to Immigrants from Sweden are Immigrants from Japan ($65,518, a difference of 0.17%), Cypriot ($65,549, a difference of 0.22%), Burmese ($65,236, a difference of 0.26%), Indian (Asian) ($66,078, a difference of 1.0%), and Immigrants from Belgium ($66,125, a difference of 1.1%). Similarly, the demographic groups most similar to Immigrants from Taiwan are Immigrants from India ($74,207, a difference of 0.24%), Thai ($72,135, a difference of 2.6%), Immigrants from Singapore ($71,348, a difference of 3.8%), Iranian ($70,648, a difference of 4.8%), and Immigrants from Hong Kong ($70,146, a difference of 5.5%).
| Demographics | Rating | Rank | Median Male Earnings |
| Immigrants | India | 100.0 /100 | #2 | Exceptional $74,207 |
| Immigrants | Taiwan | 100.0 /100 | #3 | Exceptional $74,031 |
| Thais | 100.0 /100 | #4 | Exceptional $72,135 |
| Immigrants | Singapore | 100.0 /100 | #5 | Exceptional $71,348 |
| Iranians | 100.0 /100 | #6 | Exceptional $70,648 |
| Immigrants | Hong Kong | 100.0 /100 | #7 | Exceptional $70,146 |
| Immigrants | Iran | 100.0 /100 | #8 | Exceptional $69,284 |
| Immigrants | South Central Asia | 100.0 /100 | #9 | Exceptional $68,960 |
| Immigrants | Israel | 100.0 /100 | #10 | Exceptional $68,716 |
| Immigrants | Ireland | 100.0 /100 | #11 | Exceptional $67,698 |
| Immigrants | Australia | 100.0 /100 | #12 | Exceptional $67,634 |
| Immigrants | China | 100.0 /100 | #13 | Exceptional $67,353 |
| Okinawans | 100.0 /100 | #14 | Exceptional $67,232 |
| Immigrants | Eastern Asia | 100.0 /100 | #15 | Exceptional $66,903 |
| Eastern Europeans | 100.0 /100 | #16 | Exceptional $66,472 |
| Immigrants | Belgium | 100.0 /100 | #17 | Exceptional $66,125 |
| Indians (Asian) | 100.0 /100 | #18 | Exceptional $66,078 |
| Cypriots | 100.0 /100 | #19 | Exceptional $65,549 |
| Immigrants | Japan | 100.0 /100 | #20 | Exceptional $65,518 |
| Immigrants | Sweden | 100.0 /100 | #21 | Exceptional $65,406 |
| Burmese | 100.0 /100 | #22 | Exceptional $65,236 |