Immigrants from Middle Africa vs Immigrants from Taiwan Median Male Earnings
COMPARE
Immigrants from Middle Africa
Immigrants from Taiwan
Median Male Earnings
Median Male Earnings Comparison
Immigrants from Middle Africa
Immigrants from Taiwan
$49,201
MEDIAN MALE EARNINGS
0.6/ 100
METRIC RATING
264th/ 347
METRIC RANK
$74,031
MEDIAN MALE EARNINGS
100.0/ 100
METRIC RATING
3rd/ 347
METRIC RANK
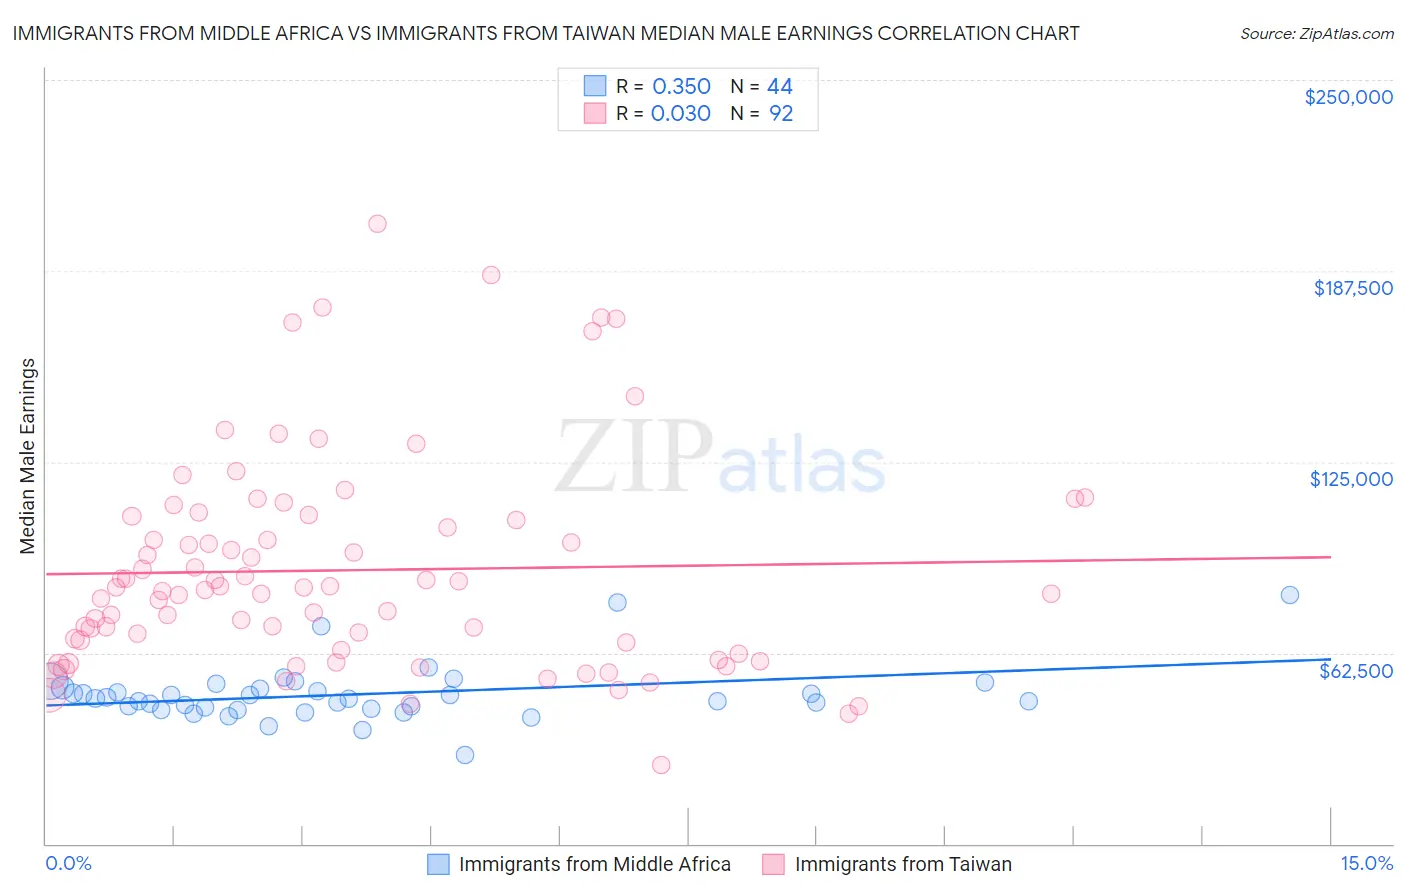
Immigrants from Middle Africa vs Immigrants from Taiwan Median Male Earnings Correlation Chart
The statistical analysis conducted on geographies consisting of 202,728,043 people shows a mild positive correlation between the proportion of Immigrants from Middle Africa and median male earnings in the United States with a correlation coefficient (R) of 0.350 and weighted average of $49,201. Similarly, the statistical analysis conducted on geographies consisting of 298,261,380 people shows no correlation between the proportion of Immigrants from Taiwan and median male earnings in the United States with a correlation coefficient (R) of 0.030 and weighted average of $74,031, a difference of 50.5%.
Median Male Earnings Correlation Summary
| Measurement | Immigrants from Middle Africa | Immigrants from Taiwan |
| Minimum | $28,882 | $25,921 |
| Maximum | $81,458 | $202,837 |
| Range | $52,576 | $176,916 |
| Mean | $48,940 | $89,558 |
| Median | $47,419 | $83,311 |
| Interquartile 25% (IQ1) | $44,462 | $64,686 |
| Interquartile 75% (IQ3) | $50,890 | $106,599 |
| Interquartile Range (IQR) | $6,428 | $41,914 |
| Standard Deviation (Sample) | $9,309 | $34,934 |
| Standard Deviation (Population) | $9,202 | $34,744 |
Similar Demographics by Median Male Earnings
Demographics Similar to Immigrants from Middle Africa by Median Male Earnings
In terms of median male earnings, the demographic groups most similar to Immigrants from Middle Africa are Immigrants from Laos ($49,190, a difference of 0.020%), Nicaraguan ($49,215, a difference of 0.030%), Immigrants from West Indies ($49,271, a difference of 0.14%), Liberian ($49,318, a difference of 0.24%), and Iroquois ($49,374, a difference of 0.35%).
| Demographics | Rating | Rank | Median Male Earnings |
| British West Indians | 0.8 /100 | #257 | Tragic $49,636 |
| Cree | 0.7 /100 | #258 | Tragic $49,497 |
| Nepalese | 0.7 /100 | #259 | Tragic $49,458 |
| Iroquois | 0.7 /100 | #260 | Tragic $49,374 |
| Liberians | 0.6 /100 | #261 | Tragic $49,318 |
| Immigrants | West Indies | 0.6 /100 | #262 | Tragic $49,271 |
| Nicaraguans | 0.6 /100 | #263 | Tragic $49,215 |
| Immigrants | Middle Africa | 0.6 /100 | #264 | Tragic $49,201 |
| Immigrants | Laos | 0.6 /100 | #265 | Tragic $49,190 |
| Somalis | 0.5 /100 | #266 | Tragic $49,025 |
| Spanish Americans | 0.5 /100 | #267 | Tragic $49,008 |
| Ute | 0.4 /100 | #268 | Tragic $48,899 |
| Tsimshian | 0.4 /100 | #269 | Tragic $48,836 |
| Potawatomi | 0.4 /100 | #270 | Tragic $48,768 |
| Cherokee | 0.3 /100 | #271 | Tragic $48,669 |
Demographics Similar to Immigrants from Taiwan by Median Male Earnings
In terms of median male earnings, the demographic groups most similar to Immigrants from Taiwan are Immigrants from India ($74,207, a difference of 0.24%), Filipino ($74,224, a difference of 0.26%), Thai ($72,135, a difference of 2.6%), Immigrants from Singapore ($71,348, a difference of 3.8%), and Iranian ($70,648, a difference of 4.8%).
| Demographics | Rating | Rank | Median Male Earnings |
| Filipinos | 100.0 /100 | #1 | Exceptional $74,224 |
| Immigrants | India | 100.0 /100 | #2 | Exceptional $74,207 |
| Immigrants | Taiwan | 100.0 /100 | #3 | Exceptional $74,031 |
| Thais | 100.0 /100 | #4 | Exceptional $72,135 |
| Immigrants | Singapore | 100.0 /100 | #5 | Exceptional $71,348 |
| Iranians | 100.0 /100 | #6 | Exceptional $70,648 |
| Immigrants | Hong Kong | 100.0 /100 | #7 | Exceptional $70,146 |
| Immigrants | Iran | 100.0 /100 | #8 | Exceptional $69,284 |
| Immigrants | South Central Asia | 100.0 /100 | #9 | Exceptional $68,960 |
| Immigrants | Israel | 100.0 /100 | #10 | Exceptional $68,716 |
| Immigrants | Ireland | 100.0 /100 | #11 | Exceptional $67,698 |
| Immigrants | Australia | 100.0 /100 | #12 | Exceptional $67,634 |
| Immigrants | China | 100.0 /100 | #13 | Exceptional $67,353 |
| Okinawans | 100.0 /100 | #14 | Exceptional $67,232 |
| Immigrants | Eastern Asia | 100.0 /100 | #15 | Exceptional $66,903 |