Slovene vs Immigrants from Taiwan Median Male Earnings
COMPARE
Slovene
Immigrants from Taiwan
Median Male Earnings
Median Male Earnings Comparison
Slovenes
Immigrants from Taiwan
$57,145
MEDIAN MALE EARNINGS
93.1/ 100
METRIC RATING
123rd/ 347
METRIC RANK
$74,031
MEDIAN MALE EARNINGS
100.0/ 100
METRIC RATING
3rd/ 347
METRIC RANK
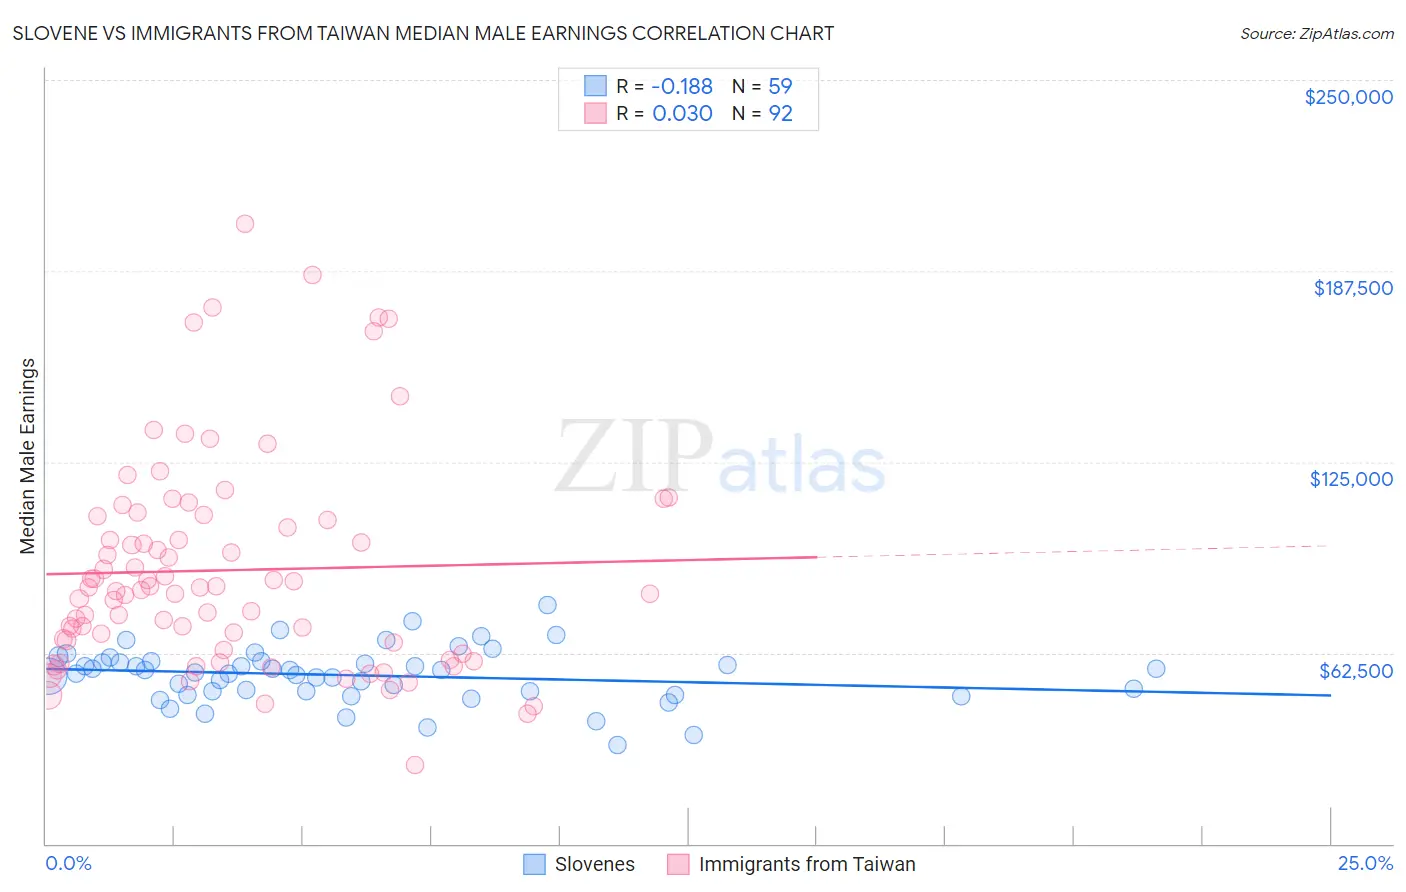
Slovene vs Immigrants from Taiwan Median Male Earnings Correlation Chart
The statistical analysis conducted on geographies consisting of 261,314,630 people shows a poor negative correlation between the proportion of Slovenes and median male earnings in the United States with a correlation coefficient (R) of -0.188 and weighted average of $57,145. Similarly, the statistical analysis conducted on geographies consisting of 298,261,380 people shows no correlation between the proportion of Immigrants from Taiwan and median male earnings in the United States with a correlation coefficient (R) of 0.030 and weighted average of $74,031, a difference of 29.5%.
Median Male Earnings Correlation Summary
| Measurement | Slovene | Immigrants from Taiwan |
| Minimum | $32,166 | $25,921 |
| Maximum | $78,136 | $202,837 |
| Range | $45,970 | $176,916 |
| Mean | $55,159 | $89,558 |
| Median | $56,030 | $83,311 |
| Interquartile 25% (IQ1) | $49,853 | $64,686 |
| Interquartile 75% (IQ3) | $59,556 | $106,599 |
| Interquartile Range (IQR) | $9,703 | $41,914 |
| Standard Deviation (Sample) | $8,904 | $34,934 |
| Standard Deviation (Population) | $8,828 | $34,744 |
Similar Demographics by Median Male Earnings
Demographics Similar to Slovenes by Median Male Earnings
In terms of median male earnings, the demographic groups most similar to Slovenes are Immigrants from Jordan ($57,145, a difference of 0.0%), Immigrants from Albania ($57,179, a difference of 0.060%), Canadian ($57,286, a difference of 0.25%), Arab ($57,298, a difference of 0.27%), and Hungarian ($57,309, a difference of 0.29%).
| Demographics | Rating | Rank | Median Male Earnings |
| Lebanese | 94.6 /100 | #116 | Exceptional $57,409 |
| Immigrants | Zimbabwe | 94.3 /100 | #117 | Exceptional $57,352 |
| Hungarians | 94.0 /100 | #118 | Exceptional $57,309 |
| Arabs | 94.0 /100 | #119 | Exceptional $57,298 |
| Canadians | 93.9 /100 | #120 | Exceptional $57,286 |
| Immigrants | Albania | 93.3 /100 | #121 | Exceptional $57,179 |
| Immigrants | Jordan | 93.1 /100 | #122 | Exceptional $57,145 |
| Slovenes | 93.1 /100 | #123 | Exceptional $57,145 |
| Chileans | 91.9 /100 | #124 | Exceptional $56,973 |
| Immigrants | Morocco | 91.8 /100 | #125 | Exceptional $56,958 |
| Chinese | 91.1 /100 | #126 | Exceptional $56,872 |
| Brazilians | 90.9 /100 | #127 | Exceptional $56,837 |
| Immigrants | Syria | 90.8 /100 | #128 | Exceptional $56,830 |
| Pakistanis | 89.9 /100 | #129 | Excellent $56,719 |
| Koreans | 89.4 /100 | #130 | Excellent $56,672 |
Demographics Similar to Immigrants from Taiwan by Median Male Earnings
In terms of median male earnings, the demographic groups most similar to Immigrants from Taiwan are Immigrants from India ($74,207, a difference of 0.24%), Filipino ($74,224, a difference of 0.26%), Thai ($72,135, a difference of 2.6%), Immigrants from Singapore ($71,348, a difference of 3.8%), and Iranian ($70,648, a difference of 4.8%).
| Demographics | Rating | Rank | Median Male Earnings |
| Filipinos | 100.0 /100 | #1 | Exceptional $74,224 |
| Immigrants | India | 100.0 /100 | #2 | Exceptional $74,207 |
| Immigrants | Taiwan | 100.0 /100 | #3 | Exceptional $74,031 |
| Thais | 100.0 /100 | #4 | Exceptional $72,135 |
| Immigrants | Singapore | 100.0 /100 | #5 | Exceptional $71,348 |
| Iranians | 100.0 /100 | #6 | Exceptional $70,648 |
| Immigrants | Hong Kong | 100.0 /100 | #7 | Exceptional $70,146 |
| Immigrants | Iran | 100.0 /100 | #8 | Exceptional $69,284 |
| Immigrants | South Central Asia | 100.0 /100 | #9 | Exceptional $68,960 |
| Immigrants | Israel | 100.0 /100 | #10 | Exceptional $68,716 |
| Immigrants | Ireland | 100.0 /100 | #11 | Exceptional $67,698 |
| Immigrants | Australia | 100.0 /100 | #12 | Exceptional $67,634 |
| Immigrants | China | 100.0 /100 | #13 | Exceptional $67,353 |
| Okinawans | 100.0 /100 | #14 | Exceptional $67,232 |
| Immigrants | Eastern Asia | 100.0 /100 | #15 | Exceptional $66,903 |