Sri Lankan vs Immigrants from Jamaica Median Male Earnings
COMPARE
Sri Lankan
Immigrants from Jamaica
Median Male Earnings
Median Male Earnings Comparison
Sri Lankans
Immigrants from Jamaica
$56,136
MEDIAN MALE EARNINGS
83.4/ 100
METRIC RATING
143rd/ 347
METRIC RANK
$48,040
MEDIAN MALE EARNINGS
0.2/ 100
METRIC RATING
283rd/ 347
METRIC RANK
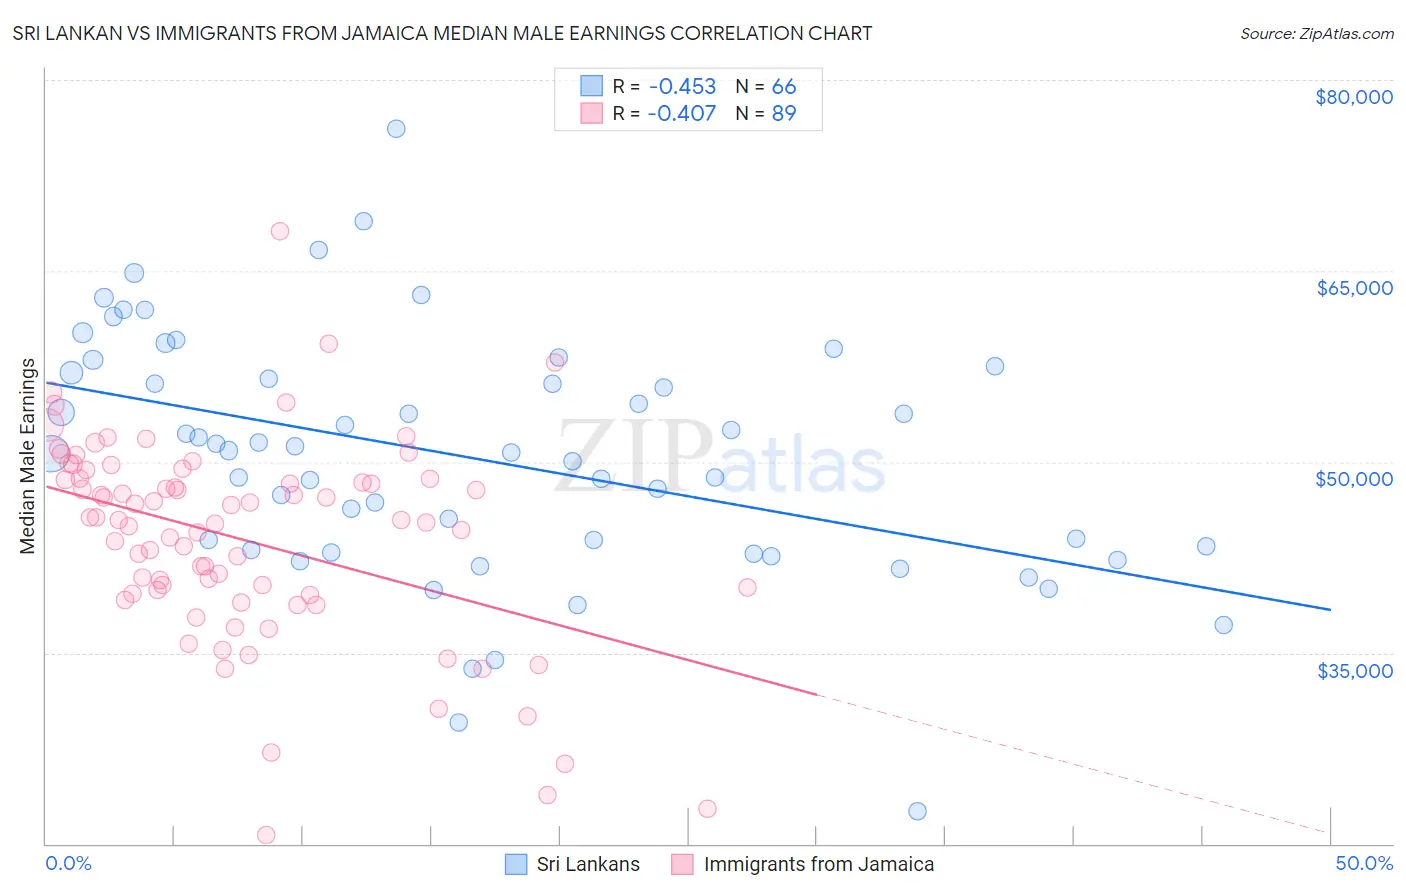
Sri Lankan vs Immigrants from Jamaica Median Male Earnings Correlation Chart
The statistical analysis conducted on geographies consisting of 440,493,989 people shows a moderate negative correlation between the proportion of Sri Lankans and median male earnings in the United States with a correlation coefficient (R) of -0.453 and weighted average of $56,136. Similarly, the statistical analysis conducted on geographies consisting of 301,762,663 people shows a moderate negative correlation between the proportion of Immigrants from Jamaica and median male earnings in the United States with a correlation coefficient (R) of -0.407 and weighted average of $48,040, a difference of 16.9%.
Median Male Earnings Correlation Summary
| Measurement | Sri Lankan | Immigrants from Jamaica |
| Minimum | $22,532 | $20,648 |
| Maximum | $76,188 | $68,125 |
| Range | $53,656 | $47,477 |
| Mean | $50,350 | $43,924 |
| Median | $50,806 | $45,397 |
| Interquartile 25% (IQ1) | $43,067 | $39,601 |
| Interquartile 75% (IQ3) | $57,026 | $48,697 |
| Interquartile Range (IQR) | $13,959 | $9,096 |
| Standard Deviation (Sample) | $9,663 | $8,088 |
| Standard Deviation (Population) | $9,589 | $8,042 |
Similar Demographics by Median Male Earnings
Demographics Similar to Sri Lankans by Median Male Earnings
In terms of median male earnings, the demographic groups most similar to Sri Lankans are Immigrants from Uganda ($56,064, a difference of 0.13%), Danish ($56,246, a difference of 0.19%), Ethiopian ($56,243, a difference of 0.19%), Zimbabwean ($56,302, a difference of 0.29%), and Luxembourger ($56,300, a difference of 0.29%).
| Demographics | Rating | Rank | Median Male Earnings |
| Immigrants | Saudi Arabia | 87.2 /100 | #136 | Excellent $56,452 |
| Slavs | 86.5 /100 | #137 | Excellent $56,390 |
| Slovaks | 85.5 /100 | #138 | Excellent $56,306 |
| Zimbabweans | 85.5 /100 | #139 | Excellent $56,302 |
| Luxembourgers | 85.5 /100 | #140 | Excellent $56,300 |
| Danes | 84.8 /100 | #141 | Excellent $56,246 |
| Ethiopians | 84.8 /100 | #142 | Excellent $56,243 |
| Sri Lankans | 83.4 /100 | #143 | Excellent $56,136 |
| Immigrants | Uganda | 82.4 /100 | #144 | Excellent $56,064 |
| Norwegians | 80.9 /100 | #145 | Excellent $55,965 |
| Immigrants | Chile | 80.7 /100 | #146 | Excellent $55,954 |
| Immigrants | Philippines | 78.4 /100 | #147 | Good $55,809 |
| Scottish | 78.2 /100 | #148 | Good $55,793 |
| English | 77.4 /100 | #149 | Good $55,747 |
| Swiss | 77.1 /100 | #150 | Good $55,731 |
Demographics Similar to Immigrants from Jamaica by Median Male Earnings
In terms of median male earnings, the demographic groups most similar to Immigrants from Jamaica are African ($47,994, a difference of 0.090%), Paiute ($47,991, a difference of 0.10%), Mexican American Indian ($47,990, a difference of 0.10%), Central American ($48,093, a difference of 0.11%), and Immigrants from El Salvador ($47,973, a difference of 0.14%).
| Demographics | Rating | Rank | Median Male Earnings |
| Blackfeet | 0.3 /100 | #276 | Tragic $48,402 |
| Belizeans | 0.2 /100 | #277 | Tragic $48,358 |
| Immigrants | Liberia | 0.2 /100 | #278 | Tragic $48,317 |
| Hmong | 0.2 /100 | #279 | Tragic $48,254 |
| Comanche | 0.2 /100 | #280 | Tragic $48,202 |
| Marshallese | 0.2 /100 | #281 | Tragic $48,137 |
| Central Americans | 0.2 /100 | #282 | Tragic $48,093 |
| Immigrants | Jamaica | 0.2 /100 | #283 | Tragic $48,040 |
| Africans | 0.2 /100 | #284 | Tragic $47,994 |
| Paiute | 0.2 /100 | #285 | Tragic $47,991 |
| Mexican American Indians | 0.2 /100 | #286 | Tragic $47,990 |
| Immigrants | El Salvador | 0.2 /100 | #287 | Tragic $47,973 |
| Shoshone | 0.2 /100 | #288 | Tragic $47,930 |
| Chickasaw | 0.1 /100 | #289 | Tragic $47,832 |
| Immigrants | Belize | 0.1 /100 | #290 | Tragic $47,809 |