Paiute vs Immigrants from Jamaica Median Male Earnings
COMPARE
Paiute
Immigrants from Jamaica
Median Male Earnings
Median Male Earnings Comparison
Paiute
Immigrants from Jamaica
$47,991
MEDIAN MALE EARNINGS
0.2/ 100
METRIC RATING
285th/ 347
METRIC RANK
$48,040
MEDIAN MALE EARNINGS
0.2/ 100
METRIC RATING
283rd/ 347
METRIC RANK
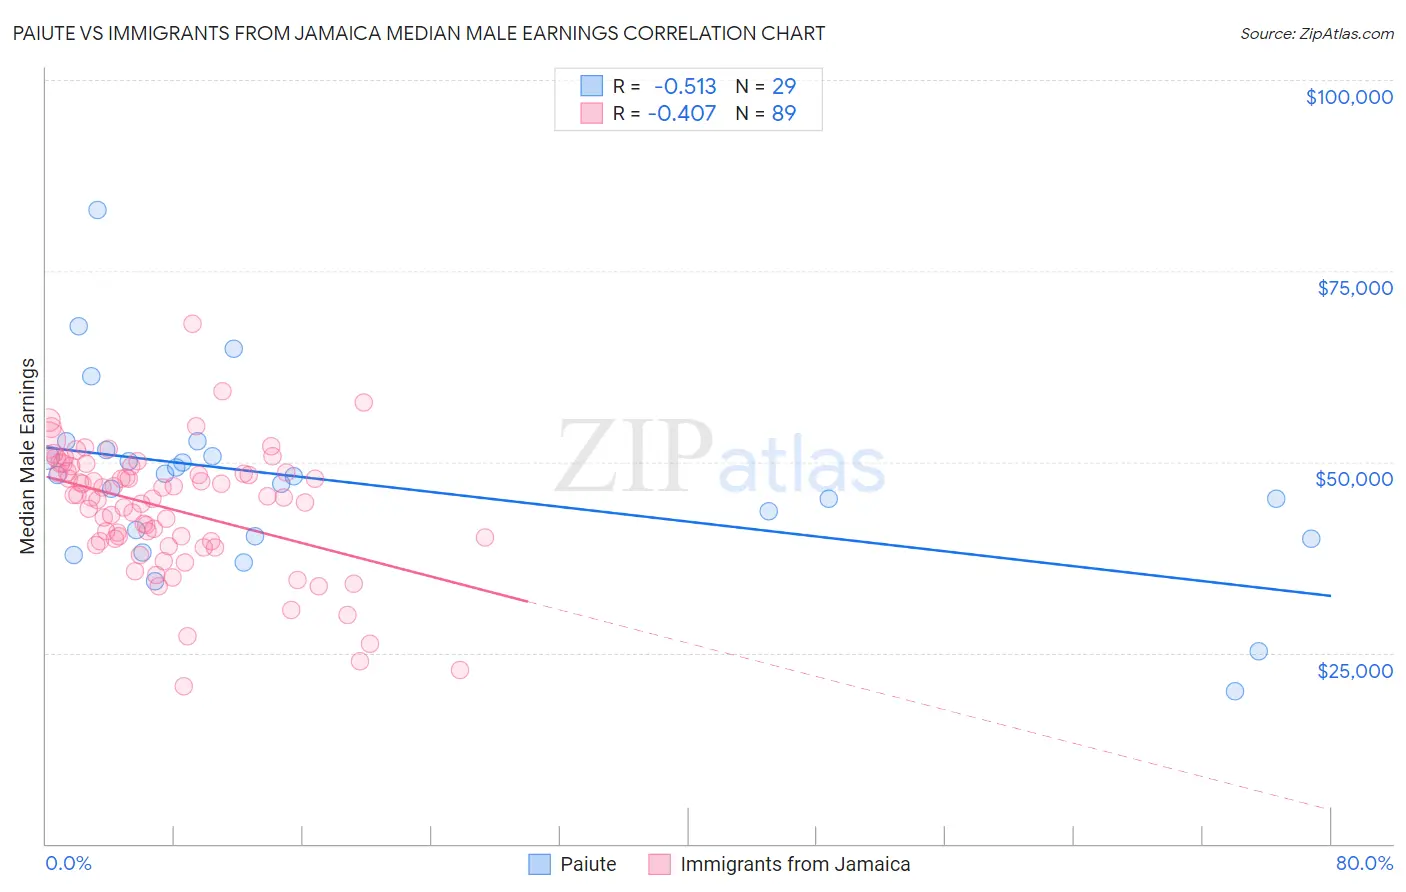
Paiute vs Immigrants from Jamaica Median Male Earnings Correlation Chart
The statistical analysis conducted on geographies consisting of 58,389,146 people shows a substantial negative correlation between the proportion of Paiute and median male earnings in the United States with a correlation coefficient (R) of -0.513 and weighted average of $47,991. Similarly, the statistical analysis conducted on geographies consisting of 301,762,663 people shows a moderate negative correlation between the proportion of Immigrants from Jamaica and median male earnings in the United States with a correlation coefficient (R) of -0.407 and weighted average of $48,040, a difference of 0.10%.
Median Male Earnings Correlation Summary
| Measurement | Paiute | Immigrants from Jamaica |
| Minimum | $19,917 | $20,648 |
| Maximum | $82,917 | $68,125 |
| Range | $63,000 | $47,477 |
| Mean | $47,248 | $43,924 |
| Median | $48,199 | $45,397 |
| Interquartile 25% (IQ1) | $40,132 | $39,601 |
| Interquartile 75% (IQ3) | $51,150 | $48,697 |
| Interquartile Range (IQR) | $11,018 | $9,096 |
| Standard Deviation (Sample) | $12,204 | $8,088 |
| Standard Deviation (Population) | $11,992 | $8,042 |
Demographics Similar to Paiute and Immigrants from Jamaica by Median Male Earnings
In terms of median male earnings, the demographic groups most similar to Paiute are Mexican American Indian ($47,990, a difference of 0.0%), African ($47,994, a difference of 0.010%), Immigrants from El Salvador ($47,973, a difference of 0.040%), Shoshone ($47,930, a difference of 0.13%), and Central American ($48,093, a difference of 0.21%). Similarly, the demographic groups most similar to Immigrants from Jamaica are African ($47,994, a difference of 0.090%), Mexican American Indian ($47,990, a difference of 0.10%), Central American ($48,093, a difference of 0.11%), Immigrants from El Salvador ($47,973, a difference of 0.14%), and Marshallese ($48,137, a difference of 0.20%).
| Demographics | Rating | Rank | Median Male Earnings |
| Colville | 0.3 /100 | #274 | Tragic $48,516 |
| Immigrants | Somalia | 0.3 /100 | #275 | Tragic $48,439 |
| Blackfeet | 0.3 /100 | #276 | Tragic $48,402 |
| Belizeans | 0.2 /100 | #277 | Tragic $48,358 |
| Immigrants | Liberia | 0.2 /100 | #278 | Tragic $48,317 |
| Hmong | 0.2 /100 | #279 | Tragic $48,254 |
| Comanche | 0.2 /100 | #280 | Tragic $48,202 |
| Marshallese | 0.2 /100 | #281 | Tragic $48,137 |
| Central Americans | 0.2 /100 | #282 | Tragic $48,093 |
| Immigrants | Jamaica | 0.2 /100 | #283 | Tragic $48,040 |
| Africans | 0.2 /100 | #284 | Tragic $47,994 |
| Paiute | 0.2 /100 | #285 | Tragic $47,991 |
| Mexican American Indians | 0.2 /100 | #286 | Tragic $47,990 |
| Immigrants | El Salvador | 0.2 /100 | #287 | Tragic $47,973 |
| Shoshone | 0.2 /100 | #288 | Tragic $47,930 |
| Chickasaw | 0.1 /100 | #289 | Tragic $47,832 |
| Immigrants | Belize | 0.1 /100 | #290 | Tragic $47,809 |
| Choctaw | 0.1 /100 | #291 | Tragic $47,729 |
| Immigrants | Dominica | 0.1 /100 | #292 | Tragic $47,651 |
| Indonesians | 0.1 /100 | #293 | Tragic $47,503 |
| Immigrants | Nicaragua | 0.1 /100 | #294 | Tragic $47,482 |