Bangladeshi vs Immigrants from Jamaica Median Male Earnings
COMPARE
Bangladeshi
Immigrants from Jamaica
Median Male Earnings
Median Male Earnings Comparison
Bangladeshis
Immigrants from Jamaica
$46,744
MEDIAN MALE EARNINGS
0.1/ 100
METRIC RATING
304th/ 347
METRIC RANK
$48,040
MEDIAN MALE EARNINGS
0.2/ 100
METRIC RATING
283rd/ 347
METRIC RANK
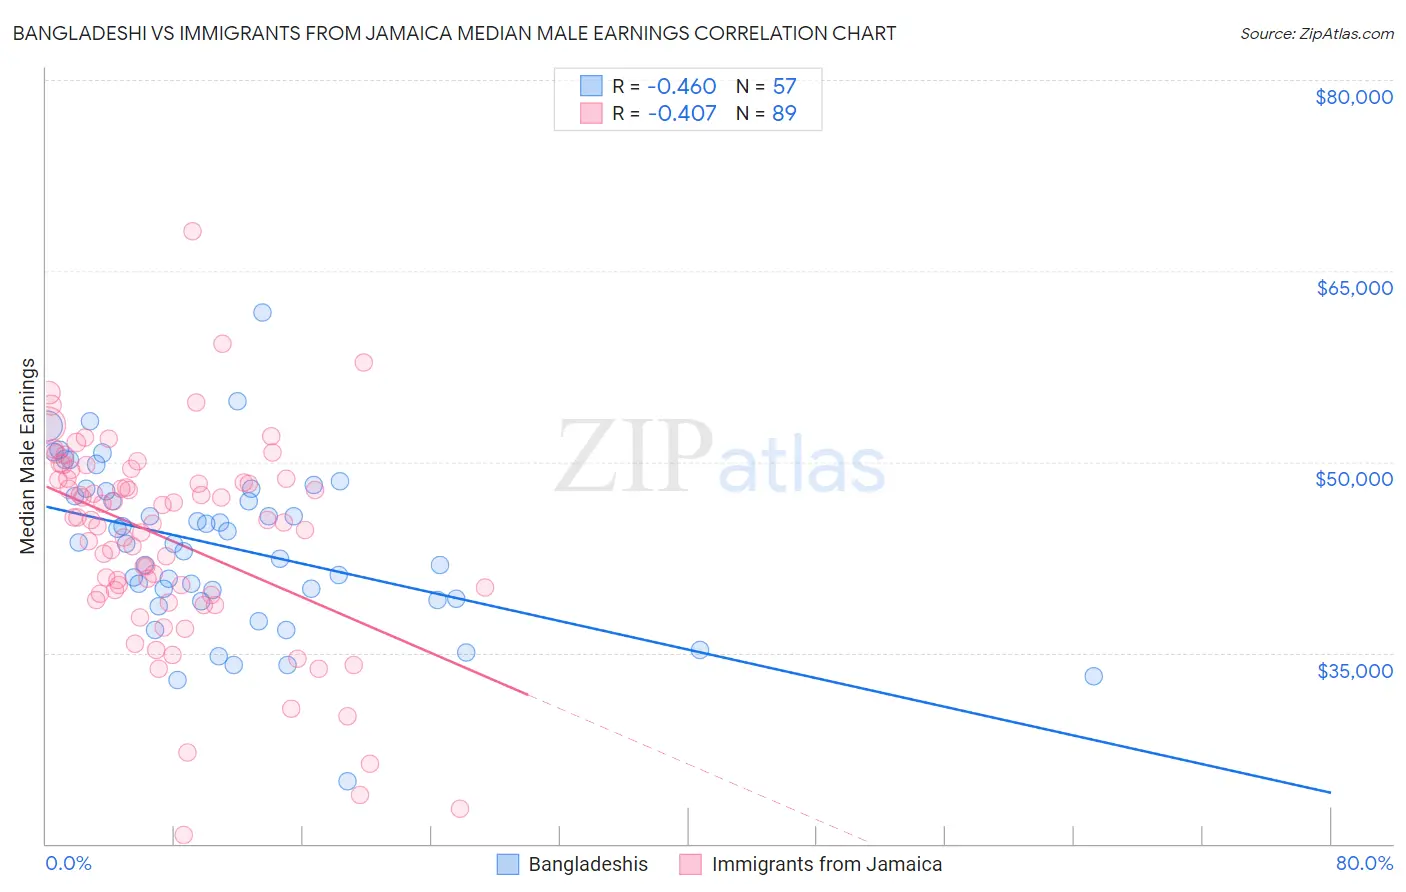
Bangladeshi vs Immigrants from Jamaica Median Male Earnings Correlation Chart
The statistical analysis conducted on geographies consisting of 141,442,222 people shows a moderate negative correlation between the proportion of Bangladeshis and median male earnings in the United States with a correlation coefficient (R) of -0.460 and weighted average of $46,744. Similarly, the statistical analysis conducted on geographies consisting of 301,762,663 people shows a moderate negative correlation between the proportion of Immigrants from Jamaica and median male earnings in the United States with a correlation coefficient (R) of -0.407 and weighted average of $48,040, a difference of 2.8%.
Median Male Earnings Correlation Summary
| Measurement | Bangladeshi | Immigrants from Jamaica |
| Minimum | $24,888 | $20,648 |
| Maximum | $61,776 | $68,125 |
| Range | $36,888 | $47,477 |
| Mean | $43,307 | $43,924 |
| Median | $43,611 | $45,397 |
| Interquartile 25% (IQ1) | $39,220 | $39,601 |
| Interquartile 75% (IQ3) | $47,786 | $48,697 |
| Interquartile Range (IQR) | $8,565 | $9,096 |
| Standard Deviation (Sample) | $6,481 | $8,088 |
| Standard Deviation (Population) | $6,424 | $8,042 |
Similar Demographics by Median Male Earnings
Demographics Similar to Bangladeshis by Median Male Earnings
In terms of median male earnings, the demographic groups most similar to Bangladeshis are Guatemalan ($46,736, a difference of 0.020%), Yaqui ($46,777, a difference of 0.070%), Seminole ($46,783, a difference of 0.080%), Dutch West Indian ($46,656, a difference of 0.19%), and Immigrants from Dominican Republic ($46,655, a difference of 0.19%).
| Demographics | Rating | Rank | Median Male Earnings |
| Dominicans | 0.1 /100 | #297 | Tragic $47,204 |
| Immigrants | Micronesia | 0.1 /100 | #298 | Tragic $47,177 |
| Immigrants | Zaire | 0.1 /100 | #299 | Tragic $47,070 |
| U.S. Virgin Islanders | 0.1 /100 | #300 | Tragic $47,066 |
| Immigrants | Latin America | 0.1 /100 | #301 | Tragic $46,941 |
| Seminole | 0.1 /100 | #302 | Tragic $46,783 |
| Yaqui | 0.1 /100 | #303 | Tragic $46,777 |
| Bangladeshis | 0.1 /100 | #304 | Tragic $46,744 |
| Guatemalans | 0.0 /100 | #305 | Tragic $46,736 |
| Dutch West Indians | 0.0 /100 | #306 | Tragic $46,656 |
| Immigrants | Dominican Republic | 0.0 /100 | #307 | Tragic $46,655 |
| Ottawa | 0.0 /100 | #308 | Tragic $46,611 |
| Creek | 0.0 /100 | #309 | Tragic $46,594 |
| Cubans | 0.0 /100 | #310 | Tragic $46,580 |
| Apache | 0.0 /100 | #311 | Tragic $46,429 |
Demographics Similar to Immigrants from Jamaica by Median Male Earnings
In terms of median male earnings, the demographic groups most similar to Immigrants from Jamaica are African ($47,994, a difference of 0.090%), Paiute ($47,991, a difference of 0.10%), Mexican American Indian ($47,990, a difference of 0.10%), Central American ($48,093, a difference of 0.11%), and Immigrants from El Salvador ($47,973, a difference of 0.14%).
| Demographics | Rating | Rank | Median Male Earnings |
| Blackfeet | 0.3 /100 | #276 | Tragic $48,402 |
| Belizeans | 0.2 /100 | #277 | Tragic $48,358 |
| Immigrants | Liberia | 0.2 /100 | #278 | Tragic $48,317 |
| Hmong | 0.2 /100 | #279 | Tragic $48,254 |
| Comanche | 0.2 /100 | #280 | Tragic $48,202 |
| Marshallese | 0.2 /100 | #281 | Tragic $48,137 |
| Central Americans | 0.2 /100 | #282 | Tragic $48,093 |
| Immigrants | Jamaica | 0.2 /100 | #283 | Tragic $48,040 |
| Africans | 0.2 /100 | #284 | Tragic $47,994 |
| Paiute | 0.2 /100 | #285 | Tragic $47,991 |
| Mexican American Indians | 0.2 /100 | #286 | Tragic $47,990 |
| Immigrants | El Salvador | 0.2 /100 | #287 | Tragic $47,973 |
| Shoshone | 0.2 /100 | #288 | Tragic $47,930 |
| Chickasaw | 0.1 /100 | #289 | Tragic $47,832 |
| Immigrants | Belize | 0.1 /100 | #290 | Tragic $47,809 |