Hmong vs Immigrants from Jamaica Median Male Earnings
COMPARE
Hmong
Immigrants from Jamaica
Median Male Earnings
Median Male Earnings Comparison
Hmong
Immigrants from Jamaica
$48,254
MEDIAN MALE EARNINGS
0.2/ 100
METRIC RATING
279th/ 347
METRIC RANK
$48,040
MEDIAN MALE EARNINGS
0.2/ 100
METRIC RATING
283rd/ 347
METRIC RANK
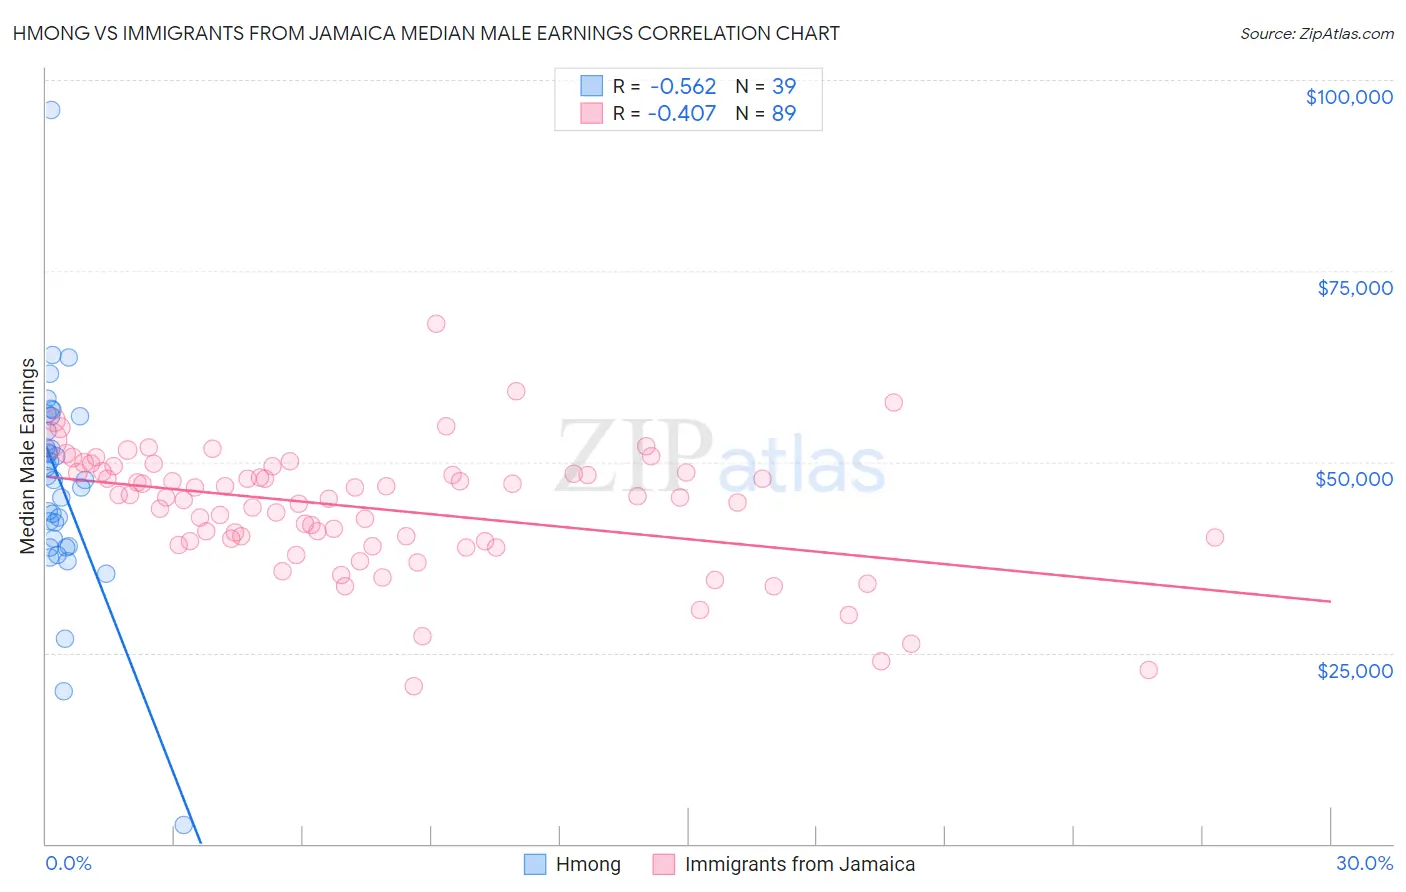
Hmong vs Immigrants from Jamaica Median Male Earnings Correlation Chart
The statistical analysis conducted on geographies consisting of 24,672,334 people shows a substantial negative correlation between the proportion of Hmong and median male earnings in the United States with a correlation coefficient (R) of -0.562 and weighted average of $48,254. Similarly, the statistical analysis conducted on geographies consisting of 301,762,663 people shows a moderate negative correlation between the proportion of Immigrants from Jamaica and median male earnings in the United States with a correlation coefficient (R) of -0.407 and weighted average of $48,040, a difference of 0.45%.
Median Male Earnings Correlation Summary
| Measurement | Hmong | Immigrants from Jamaica |
| Minimum | $2,499 | $20,648 |
| Maximum | $95,990 | $68,125 |
| Range | $93,491 | $47,477 |
| Mean | $47,121 | $43,924 |
| Median | $47,633 | $45,397 |
| Interquartile 25% (IQ1) | $38,872 | $39,601 |
| Interquartile 75% (IQ3) | $55,920 | $48,697 |
| Interquartile Range (IQR) | $17,048 | $9,096 |
| Standard Deviation (Sample) | $14,307 | $8,088 |
| Standard Deviation (Population) | $14,122 | $8,042 |
Demographics Similar to Hmong and Immigrants from Jamaica by Median Male Earnings
In terms of median male earnings, the demographic groups most similar to Hmong are Comanche ($48,202, a difference of 0.11%), Immigrants from Liberia ($48,317, a difference of 0.13%), Belizean ($48,358, a difference of 0.22%), Marshallese ($48,137, a difference of 0.24%), and Blackfeet ($48,402, a difference of 0.31%). Similarly, the demographic groups most similar to Immigrants from Jamaica are African ($47,994, a difference of 0.090%), Paiute ($47,991, a difference of 0.10%), Mexican American Indian ($47,990, a difference of 0.10%), Central American ($48,093, a difference of 0.11%), and Immigrants from El Salvador ($47,973, a difference of 0.14%).
| Demographics | Rating | Rank | Median Male Earnings |
| Cherokee | 0.3 /100 | #271 | Tragic $48,669 |
| Salvadorans | 0.3 /100 | #272 | Tragic $48,646 |
| Jamaicans | 0.3 /100 | #273 | Tragic $48,632 |
| Colville | 0.3 /100 | #274 | Tragic $48,516 |
| Immigrants | Somalia | 0.3 /100 | #275 | Tragic $48,439 |
| Blackfeet | 0.3 /100 | #276 | Tragic $48,402 |
| Belizeans | 0.2 /100 | #277 | Tragic $48,358 |
| Immigrants | Liberia | 0.2 /100 | #278 | Tragic $48,317 |
| Hmong | 0.2 /100 | #279 | Tragic $48,254 |
| Comanche | 0.2 /100 | #280 | Tragic $48,202 |
| Marshallese | 0.2 /100 | #281 | Tragic $48,137 |
| Central Americans | 0.2 /100 | #282 | Tragic $48,093 |
| Immigrants | Jamaica | 0.2 /100 | #283 | Tragic $48,040 |
| Africans | 0.2 /100 | #284 | Tragic $47,994 |
| Paiute | 0.2 /100 | #285 | Tragic $47,991 |
| Mexican American Indians | 0.2 /100 | #286 | Tragic $47,990 |
| Immigrants | El Salvador | 0.2 /100 | #287 | Tragic $47,973 |
| Shoshone | 0.2 /100 | #288 | Tragic $47,930 |
| Chickasaw | 0.1 /100 | #289 | Tragic $47,832 |
| Immigrants | Belize | 0.1 /100 | #290 | Tragic $47,809 |
| Choctaw | 0.1 /100 | #291 | Tragic $47,729 |