Icelander vs Costa Rican Median Male Earnings
COMPARE
Icelander
Costa Rican
Median Male Earnings
Median Male Earnings Comparison
Icelanders
Costa Ricans
$55,415
MEDIAN MALE EARNINGS
71.2/ 100
METRIC RATING
157th/ 347
METRIC RANK
$54,279
MEDIAN MALE EARNINGS
44.8/ 100
METRIC RATING
177th/ 347
METRIC RANK
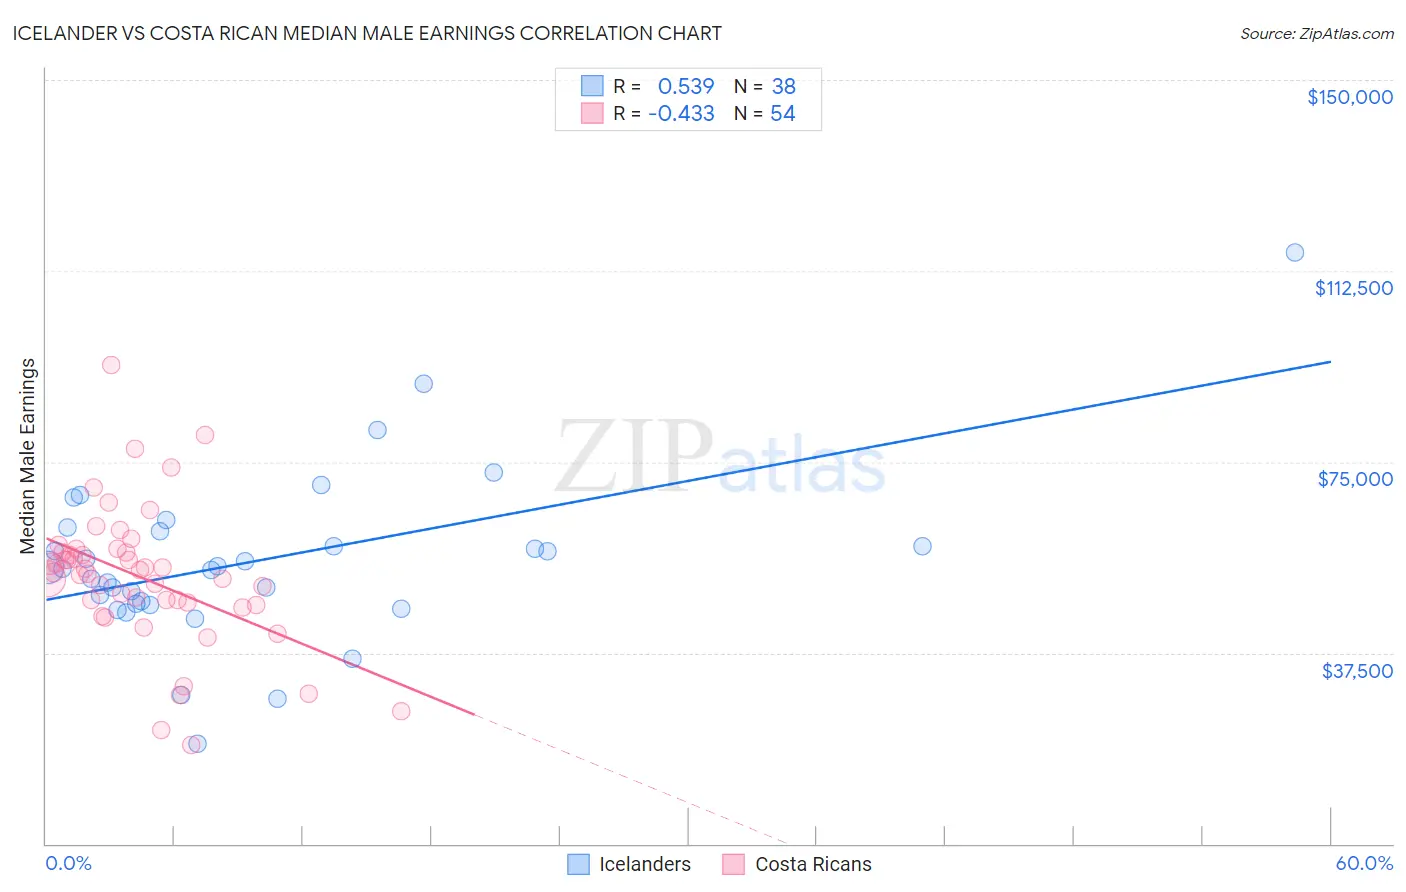
Icelander vs Costa Rican Median Male Earnings Correlation Chart
The statistical analysis conducted on geographies consisting of 159,653,287 people shows a substantial positive correlation between the proportion of Icelanders and median male earnings in the United States with a correlation coefficient (R) of 0.539 and weighted average of $55,415. Similarly, the statistical analysis conducted on geographies consisting of 253,565,867 people shows a moderate negative correlation between the proportion of Costa Ricans and median male earnings in the United States with a correlation coefficient (R) of -0.433 and weighted average of $54,279, a difference of 2.1%.
Median Male Earnings Correlation Summary
| Measurement | Icelander | Costa Rican |
| Minimum | $19,583 | $19,389 |
| Maximum | $116,188 | $93,946 |
| Range | $96,605 | $74,557 |
| Mean | $55,596 | $52,427 |
| Median | $54,221 | $53,504 |
| Interquartile 25% (IQ1) | $47,034 | $47,415 |
| Interquartile 75% (IQ3) | $61,435 | $57,229 |
| Interquartile Range (IQR) | $14,401 | $9,814 |
| Standard Deviation (Sample) | $16,814 | $13,517 |
| Standard Deviation (Population) | $16,591 | $13,391 |
Demographics Similar to Icelanders and Costa Ricans by Median Male Earnings
In terms of median male earnings, the demographic groups most similar to Icelanders are Czechoslovakian ($55,382, a difference of 0.060%), Alsatian ($55,380, a difference of 0.060%), Basque ($55,370, a difference of 0.080%), Belgian ($55,361, a difference of 0.10%), and French ($55,350, a difference of 0.12%). Similarly, the demographic groups most similar to Costa Ricans are Spaniard ($54,401, a difference of 0.22%), Dutch ($54,410, a difference of 0.24%), South American ($54,492, a difference of 0.39%), South American Indian ($54,508, a difference of 0.42%), and Welsh ($54,647, a difference of 0.68%).
| Demographics | Rating | Rank | Median Male Earnings |
| Icelanders | 71.2 /100 | #157 | Good $55,415 |
| Czechoslovakians | 70.5 /100 | #158 | Good $55,382 |
| Alsatians | 70.5 /100 | #159 | Good $55,380 |
| Basques | 70.3 /100 | #160 | Good $55,370 |
| Belgians | 70.1 /100 | #161 | Good $55,361 |
| French | 69.9 /100 | #162 | Good $55,350 |
| Ugandans | 68.6 /100 | #163 | Good $55,290 |
| Immigrants | South Eastern Asia | 67.6 /100 | #164 | Good $55,241 |
| Immigrants | Portugal | 66.3 /100 | #165 | Good $55,182 |
| Germans | 61.6 /100 | #166 | Good $54,974 |
| Immigrants | Fiji | 61.2 /100 | #167 | Good $54,958 |
| Immigrants | Vietnam | 60.2 /100 | #168 | Good $54,913 |
| French Canadians | 55.6 /100 | #169 | Average $54,722 |
| Finns | 55.6 /100 | #170 | Average $54,721 |
| Immigrants | Peru | 54.9 /100 | #171 | Average $54,695 |
| Welsh | 53.8 /100 | #172 | Average $54,647 |
| South American Indians | 50.4 /100 | #173 | Average $54,508 |
| South Americans | 50.0 /100 | #174 | Average $54,492 |
| Dutch | 48.0 /100 | #175 | Average $54,410 |
| Spaniards | 47.8 /100 | #176 | Average $54,401 |
| Costa Ricans | 44.8 /100 | #177 | Average $54,279 |