Immigrants from Middle Africa vs Costa Rican Median Male Earnings
COMPARE
Immigrants from Middle Africa
Costa Rican
Median Male Earnings
Median Male Earnings Comparison
Immigrants from Middle Africa
Costa Ricans
$49,201
MEDIAN MALE EARNINGS
0.6/ 100
METRIC RATING
264th/ 347
METRIC RANK
$54,279
MEDIAN MALE EARNINGS
44.8/ 100
METRIC RATING
177th/ 347
METRIC RANK
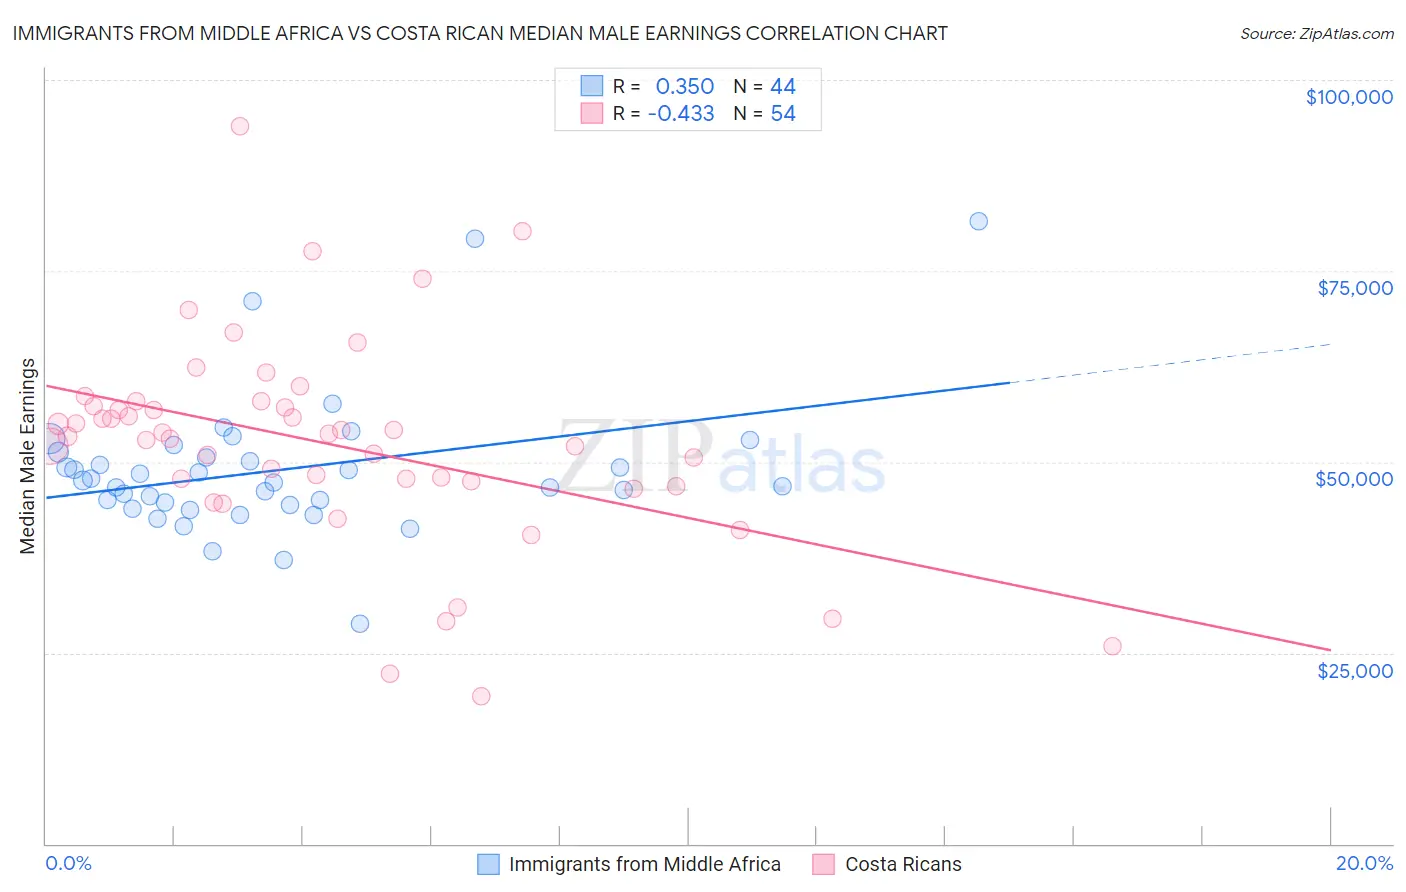
Immigrants from Middle Africa vs Costa Rican Median Male Earnings Correlation Chart
The statistical analysis conducted on geographies consisting of 202,728,043 people shows a mild positive correlation between the proportion of Immigrants from Middle Africa and median male earnings in the United States with a correlation coefficient (R) of 0.350 and weighted average of $49,201. Similarly, the statistical analysis conducted on geographies consisting of 253,565,867 people shows a moderate negative correlation between the proportion of Costa Ricans and median male earnings in the United States with a correlation coefficient (R) of -0.433 and weighted average of $54,279, a difference of 10.3%.
Median Male Earnings Correlation Summary
| Measurement | Immigrants from Middle Africa | Costa Rican |
| Minimum | $28,882 | $19,389 |
| Maximum | $81,458 | $93,946 |
| Range | $52,576 | $74,557 |
| Mean | $48,940 | $52,427 |
| Median | $47,419 | $53,504 |
| Interquartile 25% (IQ1) | $44,462 | $47,415 |
| Interquartile 75% (IQ3) | $50,890 | $57,229 |
| Interquartile Range (IQR) | $6,428 | $9,814 |
| Standard Deviation (Sample) | $9,309 | $13,517 |
| Standard Deviation (Population) | $9,202 | $13,391 |
Similar Demographics by Median Male Earnings
Demographics Similar to Immigrants from Middle Africa by Median Male Earnings
In terms of median male earnings, the demographic groups most similar to Immigrants from Middle Africa are Immigrants from Laos ($49,190, a difference of 0.020%), Nicaraguan ($49,215, a difference of 0.030%), Immigrants from West Indies ($49,271, a difference of 0.14%), Liberian ($49,318, a difference of 0.24%), and Iroquois ($49,374, a difference of 0.35%).
| Demographics | Rating | Rank | Median Male Earnings |
| British West Indians | 0.8 /100 | #257 | Tragic $49,636 |
| Cree | 0.7 /100 | #258 | Tragic $49,497 |
| Nepalese | 0.7 /100 | #259 | Tragic $49,458 |
| Iroquois | 0.7 /100 | #260 | Tragic $49,374 |
| Liberians | 0.6 /100 | #261 | Tragic $49,318 |
| Immigrants | West Indies | 0.6 /100 | #262 | Tragic $49,271 |
| Nicaraguans | 0.6 /100 | #263 | Tragic $49,215 |
| Immigrants | Middle Africa | 0.6 /100 | #264 | Tragic $49,201 |
| Immigrants | Laos | 0.6 /100 | #265 | Tragic $49,190 |
| Somalis | 0.5 /100 | #266 | Tragic $49,025 |
| Spanish Americans | 0.5 /100 | #267 | Tragic $49,008 |
| Ute | 0.4 /100 | #268 | Tragic $48,899 |
| Tsimshian | 0.4 /100 | #269 | Tragic $48,836 |
| Potawatomi | 0.4 /100 | #270 | Tragic $48,768 |
| Cherokee | 0.3 /100 | #271 | Tragic $48,669 |
Demographics Similar to Costa Ricans by Median Male Earnings
In terms of median male earnings, the demographic groups most similar to Costa Ricans are Sierra Leonean ($54,279, a difference of 0.0%), Celtic ($54,242, a difference of 0.070%), Iraqi ($54,182, a difference of 0.18%), Immigrants ($54,168, a difference of 0.21%), and Spaniard ($54,401, a difference of 0.22%).
| Demographics | Rating | Rank | Median Male Earnings |
| Finns | 55.6 /100 | #170 | Average $54,721 |
| Immigrants | Peru | 54.9 /100 | #171 | Average $54,695 |
| Welsh | 53.8 /100 | #172 | Average $54,647 |
| South American Indians | 50.4 /100 | #173 | Average $54,508 |
| South Americans | 50.0 /100 | #174 | Average $54,492 |
| Dutch | 48.0 /100 | #175 | Average $54,410 |
| Spaniards | 47.8 /100 | #176 | Average $54,401 |
| Costa Ricans | 44.8 /100 | #177 | Average $54,279 |
| Sierra Leoneans | 44.8 /100 | #178 | Average $54,279 |
| Celtics | 43.9 /100 | #179 | Average $54,242 |
| Iraqis | 42.5 /100 | #180 | Average $54,182 |
| Immigrants | Immigrants | 42.1 /100 | #181 | Average $54,168 |
| Yugoslavians | 37.4 /100 | #182 | Fair $53,967 |
| Immigrants | South America | 37.3 /100 | #183 | Fair $53,962 |
| Whites/Caucasians | 36.5 /100 | #184 | Fair $53,925 |