Carpatho Rusyn vs Costa Rican Median Male Earnings
COMPARE
Carpatho Rusyn
Costa Rican
Median Male Earnings
Median Male Earnings Comparison
Carpatho Rusyns
Costa Ricans
$57,572
MEDIAN MALE EARNINGS
95.3/ 100
METRIC RATING
113th/ 347
METRIC RANK
$54,279
MEDIAN MALE EARNINGS
44.8/ 100
METRIC RATING
177th/ 347
METRIC RANK
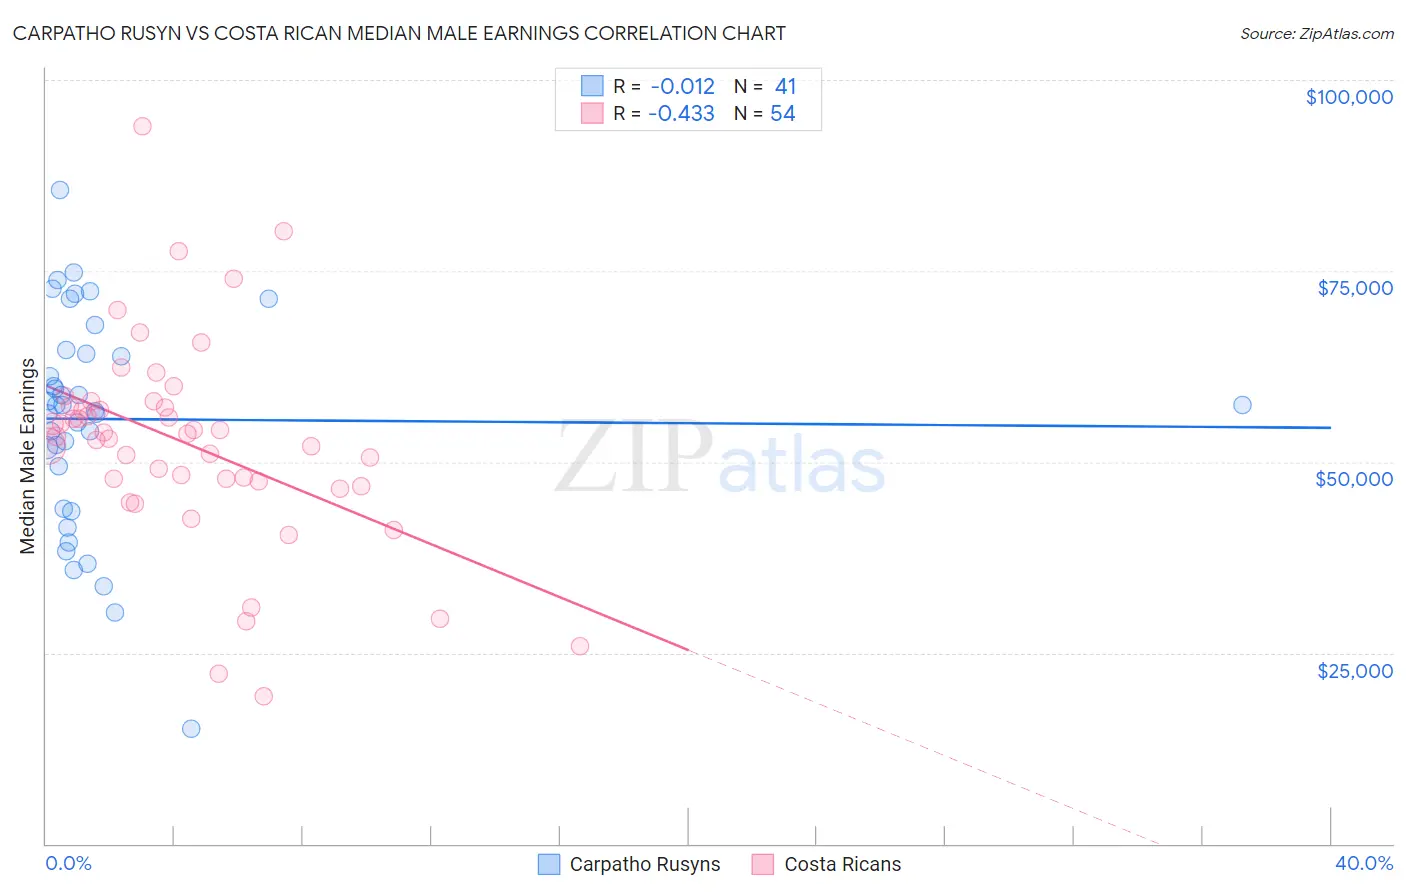
Carpatho Rusyn vs Costa Rican Median Male Earnings Correlation Chart
The statistical analysis conducted on geographies consisting of 58,862,900 people shows no correlation between the proportion of Carpatho Rusyns and median male earnings in the United States with a correlation coefficient (R) of -0.012 and weighted average of $57,572. Similarly, the statistical analysis conducted on geographies consisting of 253,565,867 people shows a moderate negative correlation between the proportion of Costa Ricans and median male earnings in the United States with a correlation coefficient (R) of -0.433 and weighted average of $54,279, a difference of 6.1%.
Median Male Earnings Correlation Summary
| Measurement | Carpatho Rusyn | Costa Rican |
| Minimum | $15,000 | $19,389 |
| Maximum | $85,583 | $93,946 |
| Range | $70,583 | $74,557 |
| Mean | $55,604 | $52,427 |
| Median | $57,395 | $53,504 |
| Interquartile 25% (IQ1) | $46,688 | $47,415 |
| Interquartile 75% (IQ3) | $64,386 | $57,229 |
| Interquartile Range (IQR) | $17,699 | $9,814 |
| Standard Deviation (Sample) | $14,187 | $13,517 |
| Standard Deviation (Population) | $14,013 | $13,391 |
Similar Demographics by Median Male Earnings
Demographics Similar to Carpatho Rusyns by Median Male Earnings
In terms of median male earnings, the demographic groups most similar to Carpatho Rusyns are Immigrants from Afghanistan ($57,582, a difference of 0.020%), Immigrants from Kuwait ($57,562, a difference of 0.020%), European ($57,637, a difference of 0.11%), Swedish ($57,445, a difference of 0.22%), and Lebanese ($57,409, a difference of 0.28%).
| Demographics | Rating | Rank | Median Male Earnings |
| Immigrants | Northern Africa | 96.9 /100 | #106 | Exceptional $58,008 |
| Serbians | 96.8 /100 | #107 | Exceptional $57,975 |
| Immigrants | Uzbekistan | 96.7 /100 | #108 | Exceptional $57,941 |
| British | 96.5 /100 | #109 | Exceptional $57,890 |
| Palestinians | 96.2 /100 | #110 | Exceptional $57,778 |
| Europeans | 95.6 /100 | #111 | Exceptional $57,637 |
| Immigrants | Afghanistan | 95.4 /100 | #112 | Exceptional $57,582 |
| Carpatho Rusyns | 95.3 /100 | #113 | Exceptional $57,572 |
| Immigrants | Kuwait | 95.3 /100 | #114 | Exceptional $57,562 |
| Swedes | 94.8 /100 | #115 | Exceptional $57,445 |
| Lebanese | 94.6 /100 | #116 | Exceptional $57,409 |
| Immigrants | Zimbabwe | 94.3 /100 | #117 | Exceptional $57,352 |
| Hungarians | 94.0 /100 | #118 | Exceptional $57,309 |
| Arabs | 94.0 /100 | #119 | Exceptional $57,298 |
| Canadians | 93.9 /100 | #120 | Exceptional $57,286 |
Demographics Similar to Costa Ricans by Median Male Earnings
In terms of median male earnings, the demographic groups most similar to Costa Ricans are Sierra Leonean ($54,279, a difference of 0.0%), Celtic ($54,242, a difference of 0.070%), Iraqi ($54,182, a difference of 0.18%), Immigrants ($54,168, a difference of 0.21%), and Spaniard ($54,401, a difference of 0.22%).
| Demographics | Rating | Rank | Median Male Earnings |
| Finns | 55.6 /100 | #170 | Average $54,721 |
| Immigrants | Peru | 54.9 /100 | #171 | Average $54,695 |
| Welsh | 53.8 /100 | #172 | Average $54,647 |
| South American Indians | 50.4 /100 | #173 | Average $54,508 |
| South Americans | 50.0 /100 | #174 | Average $54,492 |
| Dutch | 48.0 /100 | #175 | Average $54,410 |
| Spaniards | 47.8 /100 | #176 | Average $54,401 |
| Costa Ricans | 44.8 /100 | #177 | Average $54,279 |
| Sierra Leoneans | 44.8 /100 | #178 | Average $54,279 |
| Celtics | 43.9 /100 | #179 | Average $54,242 |
| Iraqis | 42.5 /100 | #180 | Average $54,182 |
| Immigrants | Immigrants | 42.1 /100 | #181 | Average $54,168 |
| Yugoslavians | 37.4 /100 | #182 | Fair $53,967 |
| Immigrants | South America | 37.3 /100 | #183 | Fair $53,962 |
| Whites/Caucasians | 36.5 /100 | #184 | Fair $53,925 |