Pima vs Sioux Median Male Earnings
COMPARE
Pima
Sioux
Median Male Earnings
Median Male Earnings Comparison
Pima
Sioux
$42,357
MEDIAN MALE EARNINGS
0.0/ 100
METRIC RATING
339th/ 347
METRIC RANK
$45,566
MEDIAN MALE EARNINGS
0.0/ 100
METRIC RATING
322nd/ 347
METRIC RANK
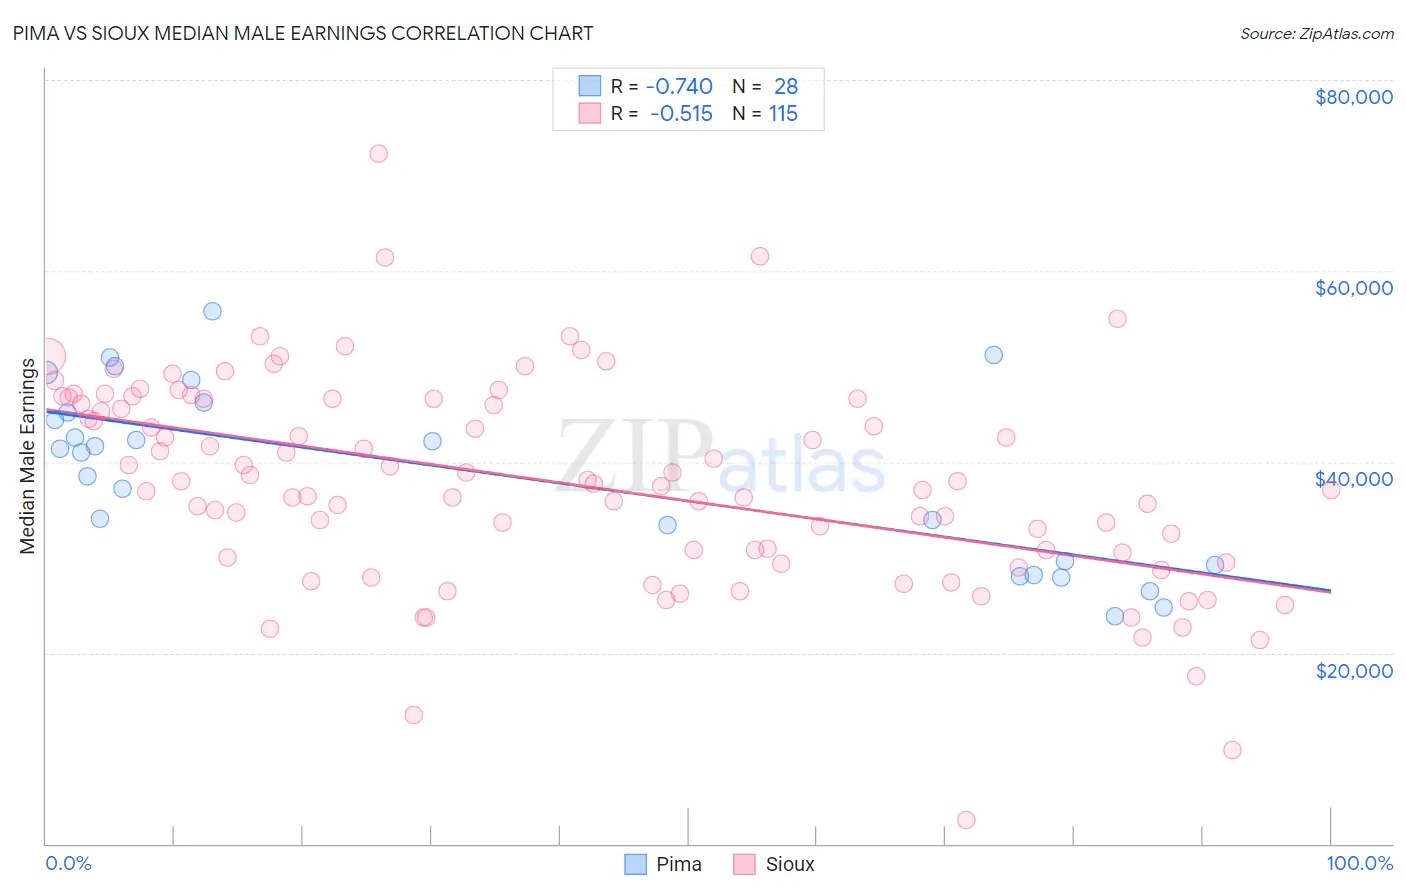
Pima vs Sioux Median Male Earnings Correlation Chart
The statistical analysis conducted on geographies consisting of 61,536,518 people shows a strong negative correlation between the proportion of Pima and median male earnings in the United States with a correlation coefficient (R) of -0.740 and weighted average of $42,357. Similarly, the statistical analysis conducted on geographies consisting of 234,123,806 people shows a substantial negative correlation between the proportion of Sioux and median male earnings in the United States with a correlation coefficient (R) of -0.515 and weighted average of $45,566, a difference of 7.6%.
Median Male Earnings Correlation Summary
| Measurement | Pima | Sioux |
| Minimum | $23,884 | $2,499 |
| Maximum | $55,769 | $72,273 |
| Range | $31,885 | $69,774 |
| Mean | $38,846 | $37,765 |
| Median | $41,189 | $37,671 |
| Interquartile 25% (IQ1) | $29,407 | $29,938 |
| Interquartile 75% (IQ3) | $45,710 | $46,607 |
| Interquartile Range (IQR) | $16,303 | $16,669 |
| Standard Deviation (Sample) | $9,196 | $10,941 |
| Standard Deviation (Population) | $9,031 | $10,893 |
Demographics Similar to Pima and Sioux by Median Male Earnings
In terms of median male earnings, the demographic groups most similar to Pima are Crow ($42,434, a difference of 0.18%), Menominee ($42,581, a difference of 0.53%), Navajo ($42,098, a difference of 0.62%), Immigrants from Cuba ($43,461, a difference of 2.6%), and Spanish American Indian ($44,010, a difference of 3.9%). Similarly, the demographic groups most similar to Sioux are Immigrants from Central America ($45,538, a difference of 0.060%), Fijian ($45,607, a difference of 0.090%), Black/African American ($45,523, a difference of 0.090%), Yuman ($45,446, a difference of 0.26%), and Immigrants from Honduras ($45,787, a difference of 0.48%).
| Demographics | Rating | Rank | Median Male Earnings |
| Immigrants | Honduras | 0.0 /100 | #320 | Tragic $45,787 |
| Fijians | 0.0 /100 | #321 | Tragic $45,607 |
| Sioux | 0.0 /100 | #322 | Tragic $45,566 |
| Immigrants | Central America | 0.0 /100 | #323 | Tragic $45,538 |
| Blacks/African Americans | 0.0 /100 | #324 | Tragic $45,523 |
| Yuman | 0.0 /100 | #325 | Tragic $45,446 |
| Immigrants | Haiti | 0.0 /100 | #326 | Tragic $45,266 |
| Immigrants | Bahamas | 0.0 /100 | #327 | Tragic $45,176 |
| Kiowa | 0.0 /100 | #328 | Tragic $45,094 |
| Yakama | 0.0 /100 | #329 | Tragic $45,002 |
| Immigrants | Mexico | 0.0 /100 | #330 | Tragic $44,960 |
| Natives/Alaskans | 0.0 /100 | #331 | Tragic $44,775 |
| Bahamians | 0.0 /100 | #332 | Tragic $44,756 |
| Immigrants | Congo | 0.0 /100 | #333 | Tragic $44,204 |
| Immigrants | Yemen | 0.0 /100 | #334 | Tragic $44,083 |
| Spanish American Indians | 0.0 /100 | #335 | Tragic $44,010 |
| Immigrants | Cuba | 0.0 /100 | #336 | Tragic $43,461 |
| Menominee | 0.0 /100 | #337 | Tragic $42,581 |
| Crow | 0.0 /100 | #338 | Tragic $42,434 |
| Pima | 0.0 /100 | #339 | Tragic $42,357 |
| Navajo | 0.0 /100 | #340 | Tragic $42,098 |