Cherokee vs Sioux Median Male Earnings
COMPARE
Cherokee
Sioux
Median Male Earnings
Median Male Earnings Comparison
Cherokee
Sioux
$48,669
MEDIAN MALE EARNINGS
0.3/ 100
METRIC RATING
271st/ 347
METRIC RANK
$45,566
MEDIAN MALE EARNINGS
0.0/ 100
METRIC RATING
322nd/ 347
METRIC RANK
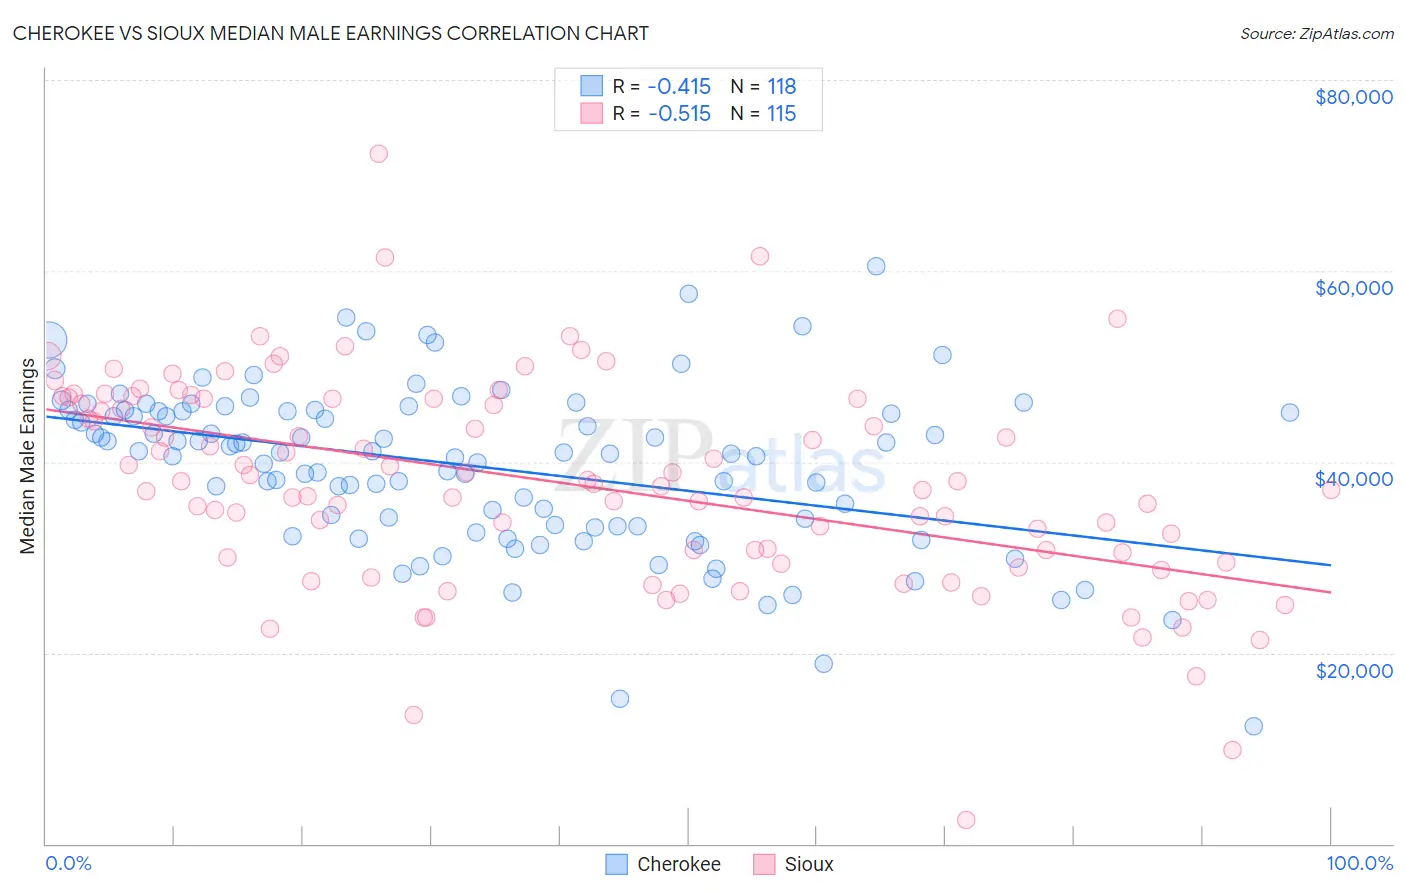
Cherokee vs Sioux Median Male Earnings Correlation Chart
The statistical analysis conducted on geographies consisting of 493,193,856 people shows a moderate negative correlation between the proportion of Cherokee and median male earnings in the United States with a correlation coefficient (R) of -0.415 and weighted average of $48,669. Similarly, the statistical analysis conducted on geographies consisting of 234,123,806 people shows a substantial negative correlation between the proportion of Sioux and median male earnings in the United States with a correlation coefficient (R) of -0.515 and weighted average of $45,566, a difference of 6.8%.
Median Male Earnings Correlation Summary
| Measurement | Cherokee | Sioux |
| Minimum | $12,361 | $2,499 |
| Maximum | $60,438 | $72,273 |
| Range | $48,077 | $69,774 |
| Mean | $39,586 | $37,765 |
| Median | $40,957 | $37,671 |
| Interquartile 25% (IQ1) | $33,308 | $29,938 |
| Interquartile 75% (IQ3) | $45,365 | $46,607 |
| Interquartile Range (IQR) | $12,057 | $16,669 |
| Standard Deviation (Sample) | $8,544 | $10,941 |
| Standard Deviation (Population) | $8,508 | $10,893 |
Similar Demographics by Median Male Earnings
Demographics Similar to Cherokee by Median Male Earnings
In terms of median male earnings, the demographic groups most similar to Cherokee are Salvadoran ($48,646, a difference of 0.050%), Jamaican ($48,632, a difference of 0.080%), Potawatomi ($48,768, a difference of 0.20%), Colville ($48,516, a difference of 0.32%), and Tsimshian ($48,836, a difference of 0.34%).
| Demographics | Rating | Rank | Median Male Earnings |
| Immigrants | Middle Africa | 0.6 /100 | #264 | Tragic $49,201 |
| Immigrants | Laos | 0.6 /100 | #265 | Tragic $49,190 |
| Somalis | 0.5 /100 | #266 | Tragic $49,025 |
| Spanish Americans | 0.5 /100 | #267 | Tragic $49,008 |
| Ute | 0.4 /100 | #268 | Tragic $48,899 |
| Tsimshian | 0.4 /100 | #269 | Tragic $48,836 |
| Potawatomi | 0.4 /100 | #270 | Tragic $48,768 |
| Cherokee | 0.3 /100 | #271 | Tragic $48,669 |
| Salvadorans | 0.3 /100 | #272 | Tragic $48,646 |
| Jamaicans | 0.3 /100 | #273 | Tragic $48,632 |
| Colville | 0.3 /100 | #274 | Tragic $48,516 |
| Immigrants | Somalia | 0.3 /100 | #275 | Tragic $48,439 |
| Blackfeet | 0.3 /100 | #276 | Tragic $48,402 |
| Belizeans | 0.2 /100 | #277 | Tragic $48,358 |
| Immigrants | Liberia | 0.2 /100 | #278 | Tragic $48,317 |
Demographics Similar to Sioux by Median Male Earnings
In terms of median male earnings, the demographic groups most similar to Sioux are Immigrants from Central America ($45,538, a difference of 0.060%), Fijian ($45,607, a difference of 0.090%), Black/African American ($45,523, a difference of 0.090%), Yuman ($45,446, a difference of 0.26%), and Immigrants from Honduras ($45,787, a difference of 0.48%).
| Demographics | Rating | Rank | Median Male Earnings |
| Immigrants | Guatemala | 0.0 /100 | #315 | Tragic $46,244 |
| Immigrants | Caribbean | 0.0 /100 | #316 | Tragic $46,193 |
| Mexicans | 0.0 /100 | #317 | Tragic $46,147 |
| Cheyenne | 0.0 /100 | #318 | Tragic $46,062 |
| Haitians | 0.0 /100 | #319 | Tragic $45,903 |
| Immigrants | Honduras | 0.0 /100 | #320 | Tragic $45,787 |
| Fijians | 0.0 /100 | #321 | Tragic $45,607 |
| Sioux | 0.0 /100 | #322 | Tragic $45,566 |
| Immigrants | Central America | 0.0 /100 | #323 | Tragic $45,538 |
| Blacks/African Americans | 0.0 /100 | #324 | Tragic $45,523 |
| Yuman | 0.0 /100 | #325 | Tragic $45,446 |
| Immigrants | Haiti | 0.0 /100 | #326 | Tragic $45,266 |
| Immigrants | Bahamas | 0.0 /100 | #327 | Tragic $45,176 |
| Kiowa | 0.0 /100 | #328 | Tragic $45,094 |
| Yakama | 0.0 /100 | #329 | Tragic $45,002 |