Pima vs Cape Verdean Median Male Earnings
COMPARE
Pima
Cape Verdean
Median Male Earnings
Median Male Earnings Comparison
Pima
Cape Verdeans
$42,357
MEDIAN MALE EARNINGS
0.0/ 100
METRIC RATING
339th/ 347
METRIC RANK
$51,103
MEDIAN MALE EARNINGS
3.5/ 100
METRIC RATING
234th/ 347
METRIC RANK
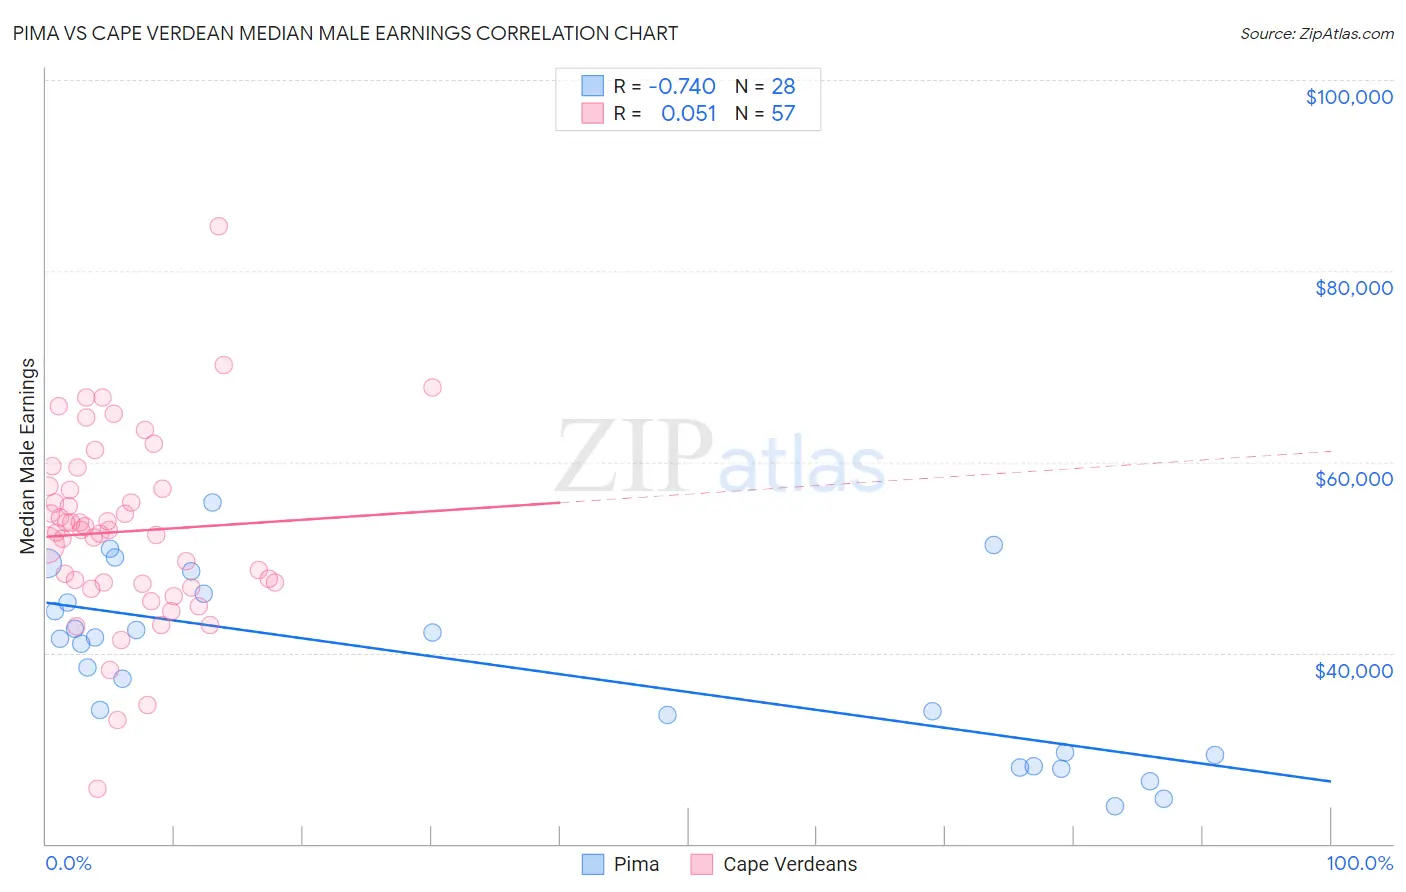
Pima vs Cape Verdean Median Male Earnings Correlation Chart
The statistical analysis conducted on geographies consisting of 61,536,518 people shows a strong negative correlation between the proportion of Pima and median male earnings in the United States with a correlation coefficient (R) of -0.740 and weighted average of $42,357. Similarly, the statistical analysis conducted on geographies consisting of 107,567,026 people shows a slight positive correlation between the proportion of Cape Verdeans and median male earnings in the United States with a correlation coefficient (R) of 0.051 and weighted average of $51,103, a difference of 20.6%.
Median Male Earnings Correlation Summary
| Measurement | Pima | Cape Verdean |
| Minimum | $23,884 | $25,819 |
| Maximum | $55,769 | $84,702 |
| Range | $31,885 | $58,883 |
| Mean | $38,846 | $52,707 |
| Median | $41,189 | $52,842 |
| Interquartile 25% (IQ1) | $29,407 | $47,020 |
| Interquartile 75% (IQ3) | $45,710 | $57,300 |
| Interquartile Range (IQR) | $16,303 | $10,280 |
| Standard Deviation (Sample) | $9,196 | $9,854 |
| Standard Deviation (Population) | $9,031 | $9,767 |
Similar Demographics by Median Male Earnings
Demographics Similar to Pima by Median Male Earnings
In terms of median male earnings, the demographic groups most similar to Pima are Crow ($42,434, a difference of 0.18%), Menominee ($42,581, a difference of 0.53%), Navajo ($42,098, a difference of 0.62%), Hopi ($42,060, a difference of 0.71%), and Arapaho ($41,758, a difference of 1.4%).
| Demographics | Rating | Rank | Median Male Earnings |
| Bahamians | 0.0 /100 | #332 | Tragic $44,756 |
| Immigrants | Congo | 0.0 /100 | #333 | Tragic $44,204 |
| Immigrants | Yemen | 0.0 /100 | #334 | Tragic $44,083 |
| Spanish American Indians | 0.0 /100 | #335 | Tragic $44,010 |
| Immigrants | Cuba | 0.0 /100 | #336 | Tragic $43,461 |
| Menominee | 0.0 /100 | #337 | Tragic $42,581 |
| Crow | 0.0 /100 | #338 | Tragic $42,434 |
| Pima | 0.0 /100 | #339 | Tragic $42,357 |
| Navajo | 0.0 /100 | #340 | Tragic $42,098 |
| Hopi | 0.0 /100 | #341 | Tragic $42,060 |
| Arapaho | 0.0 /100 | #342 | Tragic $41,758 |
| Lumbee | 0.0 /100 | #343 | Tragic $41,715 |
| Pueblo | 0.0 /100 | #344 | Tragic $41,314 |
| Puerto Ricans | 0.0 /100 | #345 | Tragic $40,071 |
| Tohono O'odham | 0.0 /100 | #346 | Tragic $39,543 |
Demographics Similar to Cape Verdeans by Median Male Earnings
In terms of median male earnings, the demographic groups most similar to Cape Verdeans are Aleut ($51,168, a difference of 0.13%), Sudanese ($51,216, a difference of 0.22%), Barbadian ($51,236, a difference of 0.26%), Immigrants from Western Africa ($50,940, a difference of 0.32%), and Immigrants from Nigeria ($51,310, a difference of 0.40%).
| Demographics | Rating | Rank | Median Male Earnings |
| Trinidadians and Tobagonians | 4.8 /100 | #227 | Tragic $51,446 |
| Samoans | 4.6 /100 | #228 | Tragic $51,389 |
| Immigrants | Trinidad and Tobago | 4.5 /100 | #229 | Tragic $51,376 |
| Immigrants | Nigeria | 4.2 /100 | #230 | Tragic $51,310 |
| Barbadians | 3.9 /100 | #231 | Tragic $51,236 |
| Sudanese | 3.9 /100 | #232 | Tragic $51,216 |
| Aleuts | 3.7 /100 | #233 | Tragic $51,168 |
| Cape Verdeans | 3.5 /100 | #234 | Tragic $51,103 |
| Immigrants | Western Africa | 3.0 /100 | #235 | Tragic $50,940 |
| Pennsylvania Germans | 2.8 /100 | #236 | Tragic $50,878 |
| Immigrants | Barbados | 2.6 /100 | #237 | Tragic $50,795 |
| Malaysians | 2.5 /100 | #238 | Tragic $50,772 |
| Americans | 2.5 /100 | #239 | Tragic $50,761 |
| West Indians | 2.3 /100 | #240 | Tragic $50,682 |
| Immigrants | St. Vincent and the Grenadines | 2.3 /100 | #241 | Tragic $50,665 |