Pima vs Alaska Native Median Male Earnings
COMPARE
Pima
Alaska Native
Median Male Earnings
Median Male Earnings Comparison
Pima
Alaska Natives
$42,357
MEDIAN MALE EARNINGS
0.0/ 100
METRIC RATING
339th/ 347
METRIC RANK
$49,711
MEDIAN MALE EARNINGS
0.9/ 100
METRIC RATING
256th/ 347
METRIC RANK
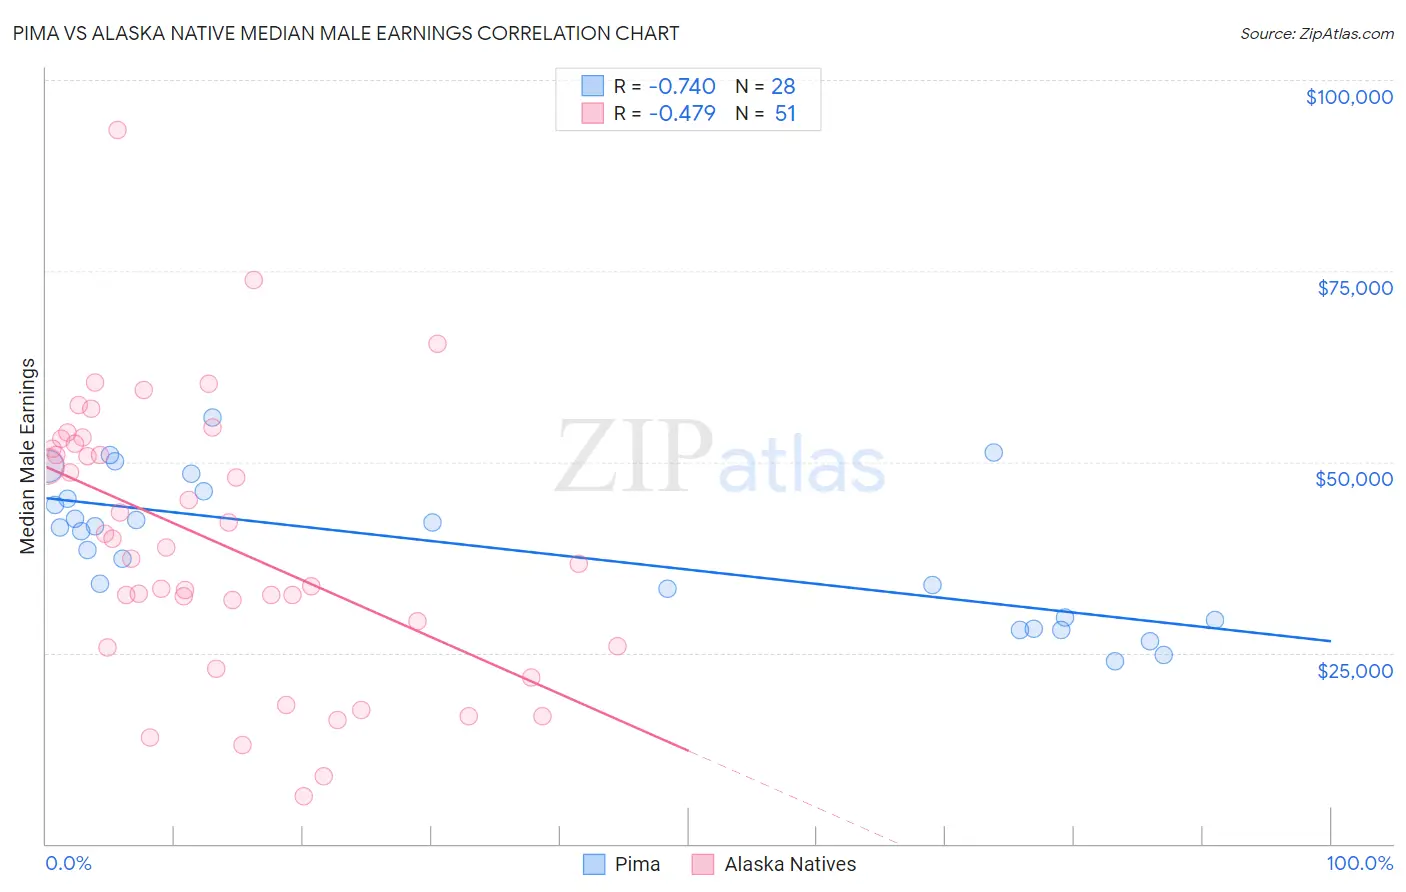
Pima vs Alaska Native Median Male Earnings Correlation Chart
The statistical analysis conducted on geographies consisting of 61,536,518 people shows a strong negative correlation between the proportion of Pima and median male earnings in the United States with a correlation coefficient (R) of -0.740 and weighted average of $42,357. Similarly, the statistical analysis conducted on geographies consisting of 76,751,910 people shows a moderate negative correlation between the proportion of Alaska Natives and median male earnings in the United States with a correlation coefficient (R) of -0.479 and weighted average of $49,711, a difference of 17.4%.
Median Male Earnings Correlation Summary
| Measurement | Pima | Alaska Native |
| Minimum | $23,884 | $6,250 |
| Maximum | $55,769 | $93,451 |
| Range | $31,885 | $87,201 |
| Mean | $38,846 | $39,521 |
| Median | $41,189 | $38,750 |
| Interquartile 25% (IQ1) | $29,407 | $25,833 |
| Interquartile 75% (IQ3) | $45,710 | $52,440 |
| Interquartile Range (IQR) | $16,303 | $26,607 |
| Standard Deviation (Sample) | $9,196 | $17,827 |
| Standard Deviation (Population) | $9,031 | $17,652 |
Similar Demographics by Median Male Earnings
Demographics Similar to Pima by Median Male Earnings
In terms of median male earnings, the demographic groups most similar to Pima are Crow ($42,434, a difference of 0.18%), Menominee ($42,581, a difference of 0.53%), Navajo ($42,098, a difference of 0.62%), Hopi ($42,060, a difference of 0.71%), and Arapaho ($41,758, a difference of 1.4%).
| Demographics | Rating | Rank | Median Male Earnings |
| Bahamians | 0.0 /100 | #332 | Tragic $44,756 |
| Immigrants | Congo | 0.0 /100 | #333 | Tragic $44,204 |
| Immigrants | Yemen | 0.0 /100 | #334 | Tragic $44,083 |
| Spanish American Indians | 0.0 /100 | #335 | Tragic $44,010 |
| Immigrants | Cuba | 0.0 /100 | #336 | Tragic $43,461 |
| Menominee | 0.0 /100 | #337 | Tragic $42,581 |
| Crow | 0.0 /100 | #338 | Tragic $42,434 |
| Pima | 0.0 /100 | #339 | Tragic $42,357 |
| Navajo | 0.0 /100 | #340 | Tragic $42,098 |
| Hopi | 0.0 /100 | #341 | Tragic $42,060 |
| Arapaho | 0.0 /100 | #342 | Tragic $41,758 |
| Lumbee | 0.0 /100 | #343 | Tragic $41,715 |
| Pueblo | 0.0 /100 | #344 | Tragic $41,314 |
| Puerto Ricans | 0.0 /100 | #345 | Tragic $40,071 |
| Tohono O'odham | 0.0 /100 | #346 | Tragic $39,543 |
Demographics Similar to Alaska Natives by Median Male Earnings
In terms of median male earnings, the demographic groups most similar to Alaska Natives are Alaskan Athabascan ($49,748, a difference of 0.070%), Senegalese ($49,774, a difference of 0.13%), British West Indian ($49,636, a difference of 0.15%), German Russian ($49,924, a difference of 0.43%), and Cree ($49,497, a difference of 0.43%).
| Demographics | Rating | Rank | Median Male Earnings |
| Immigrants | Burma/Myanmar | 1.6 /100 | #249 | Tragic $50,298 |
| Osage | 1.6 /100 | #250 | Tragic $50,292 |
| Immigrants | Grenada | 1.6 /100 | #251 | Tragic $50,279 |
| Immigrants | Cabo Verde | 1.2 /100 | #252 | Tragic $50,009 |
| German Russians | 1.1 /100 | #253 | Tragic $49,924 |
| Senegalese | 1.0 /100 | #254 | Tragic $49,774 |
| Alaskan Athabascans | 0.9 /100 | #255 | Tragic $49,748 |
| Alaska Natives | 0.9 /100 | #256 | Tragic $49,711 |
| British West Indians | 0.8 /100 | #257 | Tragic $49,636 |
| Cree | 0.7 /100 | #258 | Tragic $49,497 |
| Nepalese | 0.7 /100 | #259 | Tragic $49,458 |
| Iroquois | 0.7 /100 | #260 | Tragic $49,374 |
| Liberians | 0.6 /100 | #261 | Tragic $49,318 |
| Immigrants | West Indies | 0.6 /100 | #262 | Tragic $49,271 |
| Nicaraguans | 0.6 /100 | #263 | Tragic $49,215 |