Pima vs Sioux Householder Income Ages 45 - 64 years
COMPARE
Pima
Sioux
Householder Income Ages 45 - 64 years
Householder Income Ages 45 - 64 years Comparison
Pima
Sioux
$73,365
HOUSEHOLDER INCOME AGES 45 - 64 YEARS
0.0/ 100
METRIC RATING
343rd/ 347
METRIC RANK
$81,750
HOUSEHOLDER INCOME AGES 45 - 64 YEARS
0.0/ 100
METRIC RATING
322nd/ 347
METRIC RANK
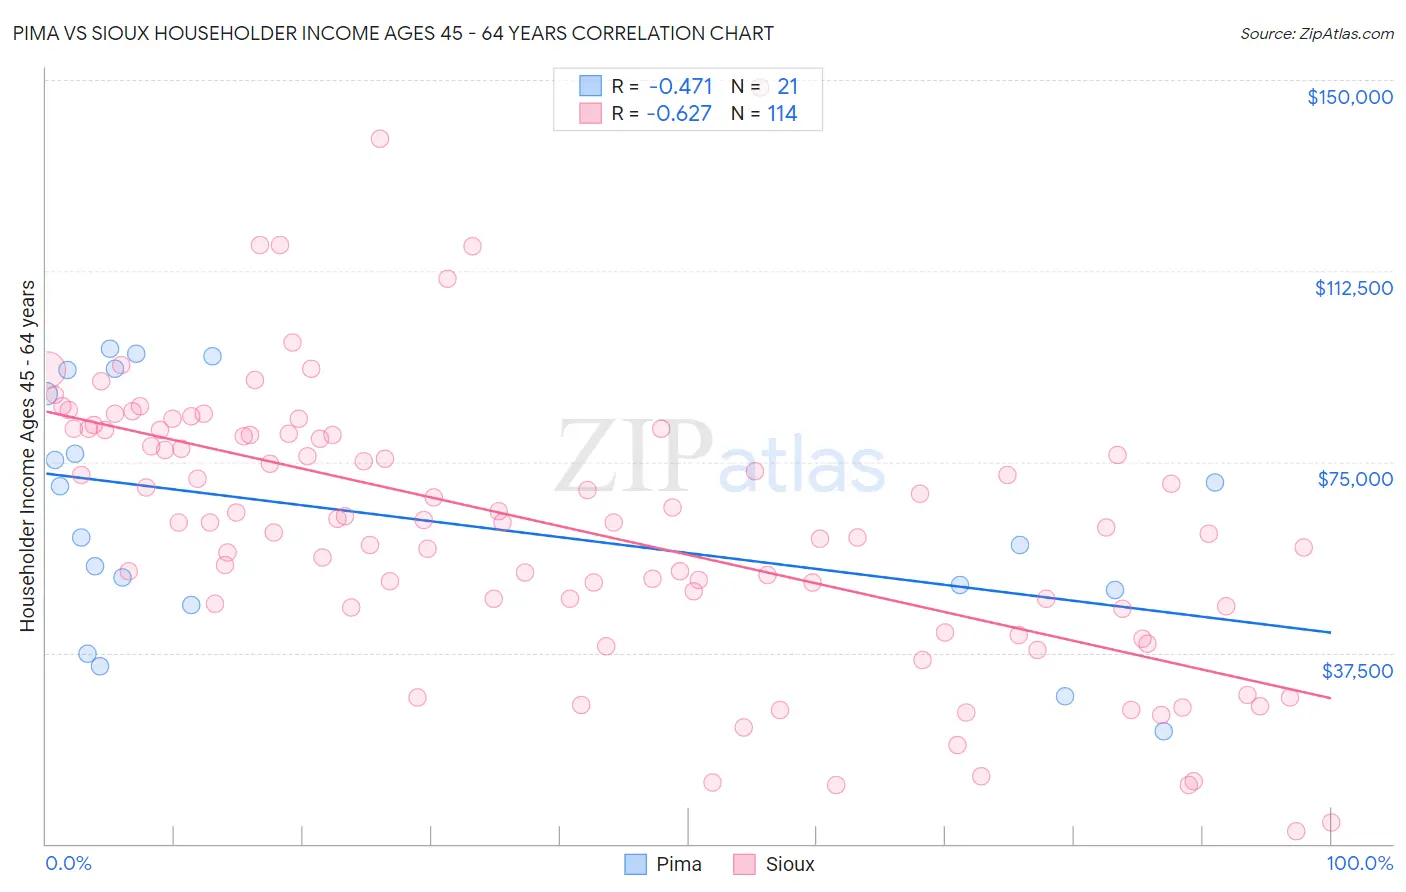
Pima vs Sioux Householder Income Ages 45 - 64 years Correlation Chart
The statistical analysis conducted on geographies consisting of 61,504,039 people shows a moderate negative correlation between the proportion of Pima and household income with householder between the ages 45 and 64 in the United States with a correlation coefficient (R) of -0.471 and weighted average of $73,365. Similarly, the statistical analysis conducted on geographies consisting of 233,839,839 people shows a significant negative correlation between the proportion of Sioux and household income with householder between the ages 45 and 64 in the United States with a correlation coefficient (R) of -0.627 and weighted average of $81,750, a difference of 11.4%.
Householder Income Ages 45 - 64 years Correlation Summary
| Measurement | Pima | Sioux |
| Minimum | $22,031 | $2,499 |
| Maximum | $97,330 | $148,571 |
| Range | $75,299 | $146,072 |
| Mean | $64,464 | $62,223 |
| Median | $60,256 | $63,145 |
| Interquartile 25% (IQ1) | $48,406 | $46,523 |
| Interquartile 75% (IQ3) | $90,706 | $80,556 |
| Interquartile Range (IQR) | $42,300 | $34,033 |
| Standard Deviation (Sample) | $23,791 | $27,229 |
| Standard Deviation (Population) | $23,218 | $27,109 |
Similar Demographics by Householder Income Ages 45 - 64 years
Demographics Similar to Pima by Householder Income Ages 45 - 64 years
In terms of householder income ages 45 - 64 years, the demographic groups most similar to Pima are Tohono O'odham ($73,774, a difference of 0.56%), Crow ($74,257, a difference of 1.2%), Immigrants from Yemen ($74,575, a difference of 1.7%), Houma ($72,093, a difference of 1.8%), and Kiowa ($74,815, a difference of 2.0%).
| Demographics | Rating | Rank | Householder Income Ages 45 - 64 years |
| Immigrants | Congo | 0.0 /100 | #333 | Tragic $77,850 |
| Menominee | 0.0 /100 | #334 | Tragic $76,903 |
| Cheyenne | 0.0 /100 | #335 | Tragic $76,362 |
| Arapaho | 0.0 /100 | #336 | Tragic $75,945 |
| Pueblo | 0.0 /100 | #337 | Tragic $75,601 |
| Hopi | 0.0 /100 | #338 | Tragic $75,562 |
| Kiowa | 0.0 /100 | #339 | Tragic $74,815 |
| Immigrants | Yemen | 0.0 /100 | #340 | Tragic $74,575 |
| Crow | 0.0 /100 | #341 | Tragic $74,257 |
| Tohono O'odham | 0.0 /100 | #342 | Tragic $73,774 |
| Pima | 0.0 /100 | #343 | Tragic $73,365 |
| Houma | 0.0 /100 | #344 | Tragic $72,093 |
| Navajo | 0.0 /100 | #345 | Tragic $69,759 |
| Puerto Ricans | 0.0 /100 | #346 | Tragic $69,234 |
| Lumbee | 0.0 /100 | #347 | Tragic $65,113 |
Demographics Similar to Sioux by Householder Income Ages 45 - 64 years
In terms of householder income ages 45 - 64 years, the demographic groups most similar to Sioux are Bahamian ($81,369, a difference of 0.47%), Yuman ($82,139, a difference of 0.48%), Apache ($82,184, a difference of 0.53%), Chickasaw ($82,193, a difference of 0.54%), and Choctaw ($82,287, a difference of 0.66%).
| Demographics | Rating | Rank | Householder Income Ages 45 - 64 years |
| Paiute | 0.0 /100 | #315 | Tragic $82,629 |
| Immigrants | Caribbean | 0.0 /100 | #316 | Tragic $82,513 |
| Colville | 0.0 /100 | #317 | Tragic $82,474 |
| Choctaw | 0.0 /100 | #318 | Tragic $82,287 |
| Chickasaw | 0.0 /100 | #319 | Tragic $82,193 |
| Apache | 0.0 /100 | #320 | Tragic $82,184 |
| Yuman | 0.0 /100 | #321 | Tragic $82,139 |
| Sioux | 0.0 /100 | #322 | Tragic $81,750 |
| Bahamians | 0.0 /100 | #323 | Tragic $81,369 |
| Yup'ik | 0.0 /100 | #324 | Tragic $81,000 |
| Immigrants | Cuba | 0.0 /100 | #325 | Tragic $80,662 |
| Dominicans | 0.0 /100 | #326 | Tragic $80,623 |
| Seminole | 0.0 /100 | #327 | Tragic $80,077 |
| Natives/Alaskans | 0.0 /100 | #328 | Tragic $79,816 |
| Dutch West Indians | 0.0 /100 | #329 | Tragic $79,171 |