Bangladeshi vs Sioux Median Male Earnings
COMPARE
Bangladeshi
Sioux
Median Male Earnings
Median Male Earnings Comparison
Bangladeshis
Sioux
$46,744
MEDIAN MALE EARNINGS
0.1/ 100
METRIC RATING
304th/ 347
METRIC RANK
$45,566
MEDIAN MALE EARNINGS
0.0/ 100
METRIC RATING
322nd/ 347
METRIC RANK
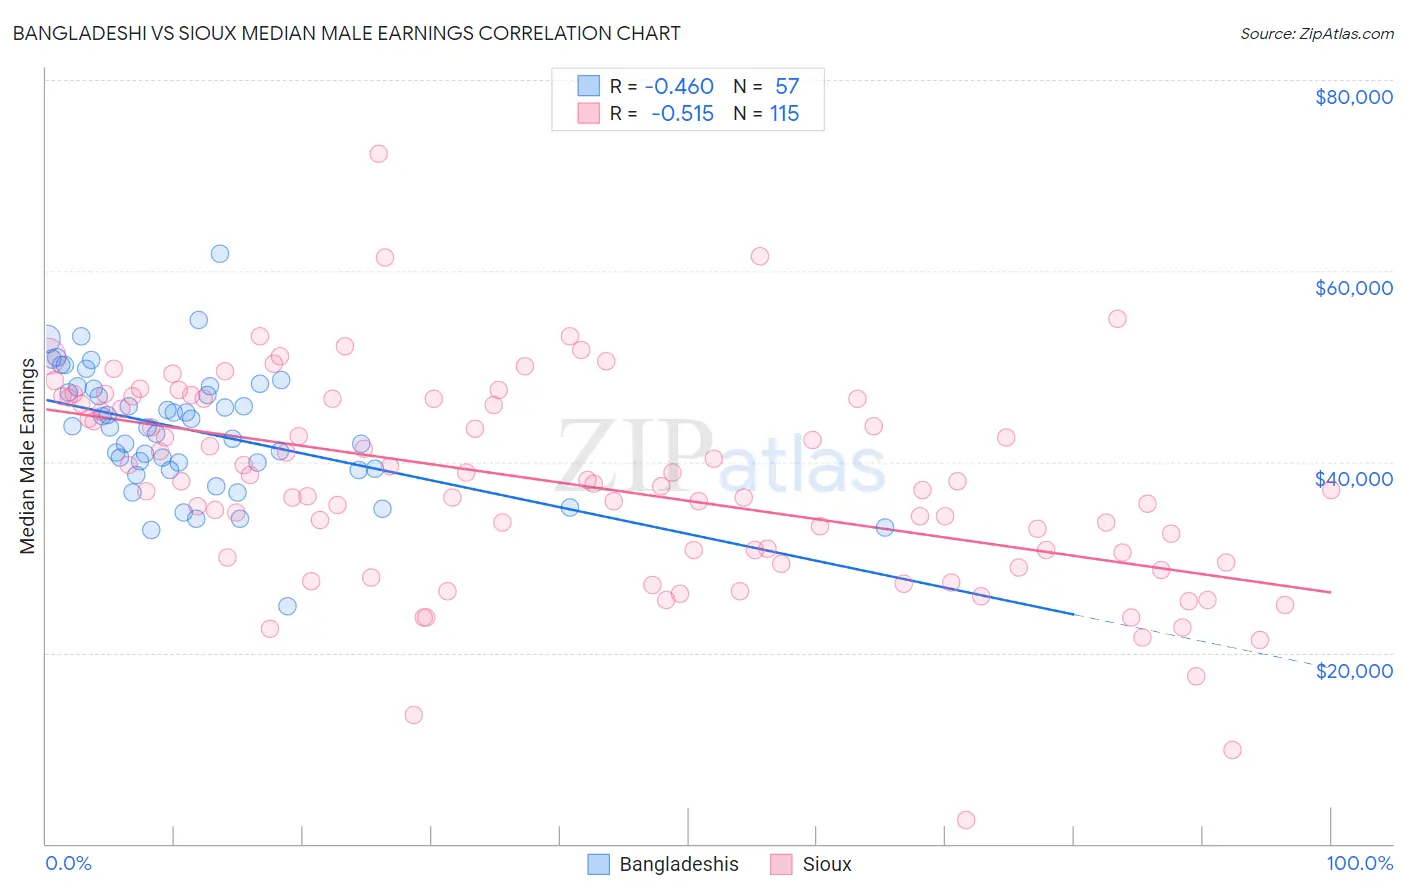
Bangladeshi vs Sioux Median Male Earnings Correlation Chart
The statistical analysis conducted on geographies consisting of 141,442,222 people shows a moderate negative correlation between the proportion of Bangladeshis and median male earnings in the United States with a correlation coefficient (R) of -0.460 and weighted average of $46,744. Similarly, the statistical analysis conducted on geographies consisting of 234,123,806 people shows a substantial negative correlation between the proportion of Sioux and median male earnings in the United States with a correlation coefficient (R) of -0.515 and weighted average of $45,566, a difference of 2.6%.
Median Male Earnings Correlation Summary
| Measurement | Bangladeshi | Sioux |
| Minimum | $24,888 | $2,499 |
| Maximum | $61,776 | $72,273 |
| Range | $36,888 | $69,774 |
| Mean | $43,307 | $37,765 |
| Median | $43,611 | $37,671 |
| Interquartile 25% (IQ1) | $39,220 | $29,938 |
| Interquartile 75% (IQ3) | $47,786 | $46,607 |
| Interquartile Range (IQR) | $8,565 | $16,669 |
| Standard Deviation (Sample) | $6,481 | $10,941 |
| Standard Deviation (Population) | $6,424 | $10,893 |
Demographics Similar to Bangladeshis and Sioux by Median Male Earnings
In terms of median male earnings, the demographic groups most similar to Bangladeshis are Guatemalan ($46,736, a difference of 0.020%), Yaqui ($46,777, a difference of 0.070%), Dutch West Indian ($46,656, a difference of 0.19%), Immigrants from Dominican Republic ($46,655, a difference of 0.19%), and Ottawa ($46,611, a difference of 0.29%). Similarly, the demographic groups most similar to Sioux are Immigrants from Central America ($45,538, a difference of 0.060%), Fijian ($45,607, a difference of 0.090%), Immigrants from Honduras ($45,787, a difference of 0.48%), Haitian ($45,903, a difference of 0.74%), and Cheyenne ($46,062, a difference of 1.1%).
| Demographics | Rating | Rank | Median Male Earnings |
| Yaqui | 0.1 /100 | #303 | Tragic $46,777 |
| Bangladeshis | 0.1 /100 | #304 | Tragic $46,744 |
| Guatemalans | 0.0 /100 | #305 | Tragic $46,736 |
| Dutch West Indians | 0.0 /100 | #306 | Tragic $46,656 |
| Immigrants | Dominican Republic | 0.0 /100 | #307 | Tragic $46,655 |
| Ottawa | 0.0 /100 | #308 | Tragic $46,611 |
| Creek | 0.0 /100 | #309 | Tragic $46,594 |
| Cubans | 0.0 /100 | #310 | Tragic $46,580 |
| Apache | 0.0 /100 | #311 | Tragic $46,429 |
| Hispanics or Latinos | 0.0 /100 | #312 | Tragic $46,419 |
| Hondurans | 0.0 /100 | #313 | Tragic $46,374 |
| Chippewa | 0.0 /100 | #314 | Tragic $46,368 |
| Immigrants | Guatemala | 0.0 /100 | #315 | Tragic $46,244 |
| Immigrants | Caribbean | 0.0 /100 | #316 | Tragic $46,193 |
| Mexicans | 0.0 /100 | #317 | Tragic $46,147 |
| Cheyenne | 0.0 /100 | #318 | Tragic $46,062 |
| Haitians | 0.0 /100 | #319 | Tragic $45,903 |
| Immigrants | Honduras | 0.0 /100 | #320 | Tragic $45,787 |
| Fijians | 0.0 /100 | #321 | Tragic $45,607 |
| Sioux | 0.0 /100 | #322 | Tragic $45,566 |
| Immigrants | Central America | 0.0 /100 | #323 | Tragic $45,538 |