Slovak vs Norwegian Median Female Earnings
COMPARE
Slovak
Norwegian
Median Female Earnings
Median Female Earnings Comparison
Slovaks
Norwegians
$39,029
MEDIAN FEMALE EARNINGS
19.9/ 100
METRIC RATING
202nd/ 347
METRIC RANK
$38,802
MEDIAN FEMALE EARNINGS
13.4/ 100
METRIC RATING
209th/ 347
METRIC RANK
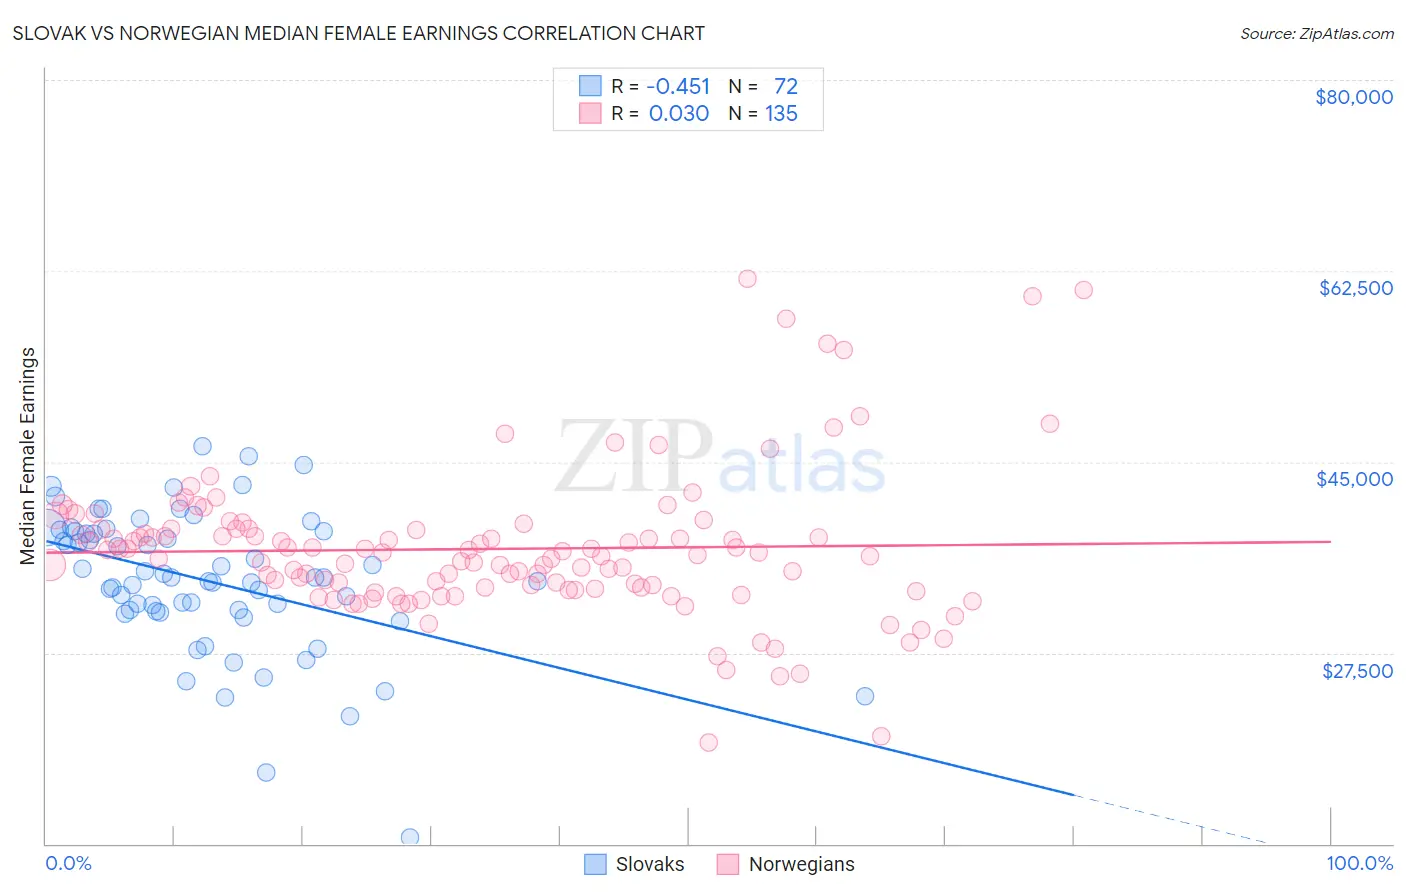
Slovak vs Norwegian Median Female Earnings Correlation Chart
The statistical analysis conducted on geographies consisting of 397,593,925 people shows a moderate negative correlation between the proportion of Slovaks and median female earnings in the United States with a correlation coefficient (R) of -0.451 and weighted average of $39,029. Similarly, the statistical analysis conducted on geographies consisting of 532,275,567 people shows no correlation between the proportion of Norwegians and median female earnings in the United States with a correlation coefficient (R) of 0.030 and weighted average of $38,802, a difference of 0.58%.
Median Female Earnings Correlation Summary
| Measurement | Slovak | Norwegian |
| Minimum | $10,580 | $19,310 |
| Maximum | $46,470 | $61,750 |
| Range | $35,890 | $42,440 |
| Mean | $34,113 | $37,022 |
| Median | $34,365 | $36,510 |
| Interquartile 25% (IQ1) | $31,338 | $33,325 |
| Interquartile 75% (IQ3) | $38,606 | $38,843 |
| Interquartile Range (IQR) | $7,268 | $5,519 |
| Standard Deviation (Sample) | $6,495 | $6,760 |
| Standard Deviation (Population) | $6,450 | $6,735 |
Demographics Similar to Slovaks and Norwegians by Median Female Earnings
In terms of median female earnings, the demographic groups most similar to Slovaks are Immigrants from Panama ($39,049, a difference of 0.050%), Panamanian ($39,049, a difference of 0.050%), Czech ($38,992, a difference of 0.090%), Icelander ($39,109, a difference of 0.21%), and Immigrants from Uruguay ($38,945, a difference of 0.22%). Similarly, the demographic groups most similar to Norwegians are Immigrants from Thailand ($38,810, a difference of 0.020%), Immigrants from Cambodia ($38,833, a difference of 0.080%), Czechoslovakian ($38,738, a difference of 0.17%), Aleut ($38,719, a difference of 0.21%), and Immigrants from Bosnia and Herzegovina ($38,886, a difference of 0.22%).
| Demographics | Rating | Rank | Median Female Earnings |
| Uruguayans | 27.3 /100 | #195 | Fair $39,228 |
| Immigrants | Costa Rica | 25.6 /100 | #196 | Fair $39,186 |
| Assyrians/Chaldeans/Syriacs | 24.6 /100 | #197 | Fair $39,159 |
| Ecuadorians | 23.0 /100 | #198 | Fair $39,117 |
| Icelanders | 22.7 /100 | #199 | Fair $39,109 |
| Immigrants | Panama | 20.6 /100 | #200 | Fair $39,049 |
| Panamanians | 20.6 /100 | #201 | Fair $39,049 |
| Slovaks | 19.9 /100 | #202 | Poor $39,029 |
| Czechs | 18.7 /100 | #203 | Poor $38,992 |
| Immigrants | Uruguay | 17.3 /100 | #204 | Poor $38,945 |
| Immigrants | Colombia | 16.3 /100 | #205 | Poor $38,913 |
| Immigrants | Bosnia and Herzegovina | 15.6 /100 | #206 | Poor $38,886 |
| Immigrants | Cambodia | 14.2 /100 | #207 | Poor $38,833 |
| Immigrants | Thailand | 13.6 /100 | #208 | Poor $38,810 |
| Norwegians | 13.4 /100 | #209 | Poor $38,802 |
| Czechoslovakians | 12.0 /100 | #210 | Poor $38,738 |
| Aleuts | 11.6 /100 | #211 | Poor $38,719 |
| Guamanians/Chamorros | 11.5 /100 | #212 | Poor $38,717 |
| Jamaicans | 10.5 /100 | #213 | Poor $38,670 |
| Iraqis | 10.5 /100 | #214 | Poor $38,666 |
| Spaniards | 10.3 /100 | #215 | Poor $38,656 |