Immigrants from Sweden vs Norwegian Median Female Earnings
COMPARE
Immigrants from Sweden
Norwegian
Median Female Earnings
Median Female Earnings Comparison
Immigrants from Sweden
Norwegians
$44,774
MEDIAN FEMALE EARNINGS
100.0/ 100
METRIC RATING
25th/ 347
METRIC RANK
$38,802
MEDIAN FEMALE EARNINGS
13.4/ 100
METRIC RATING
209th/ 347
METRIC RANK
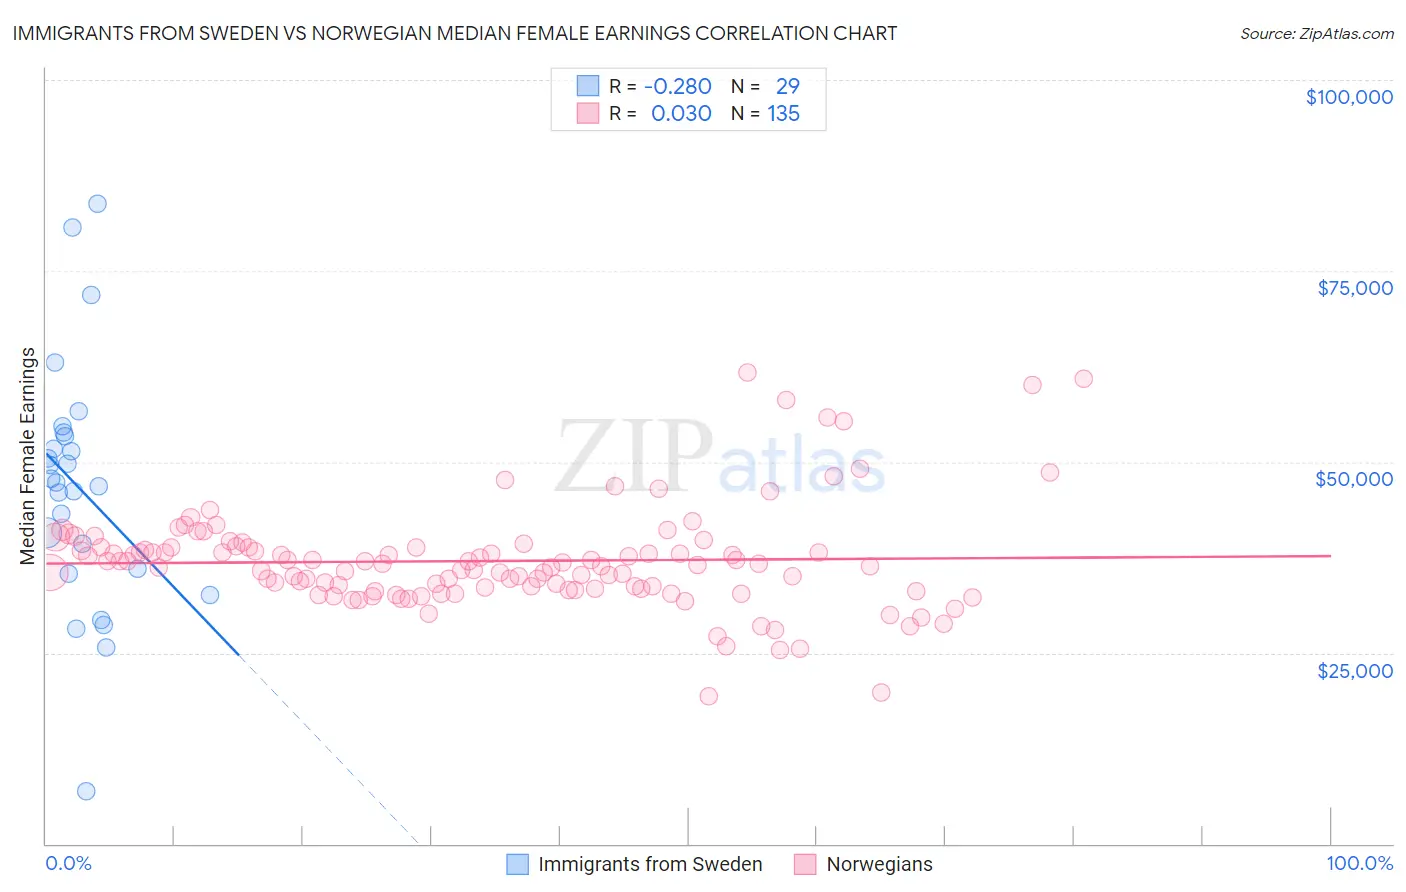
Immigrants from Sweden vs Norwegian Median Female Earnings Correlation Chart
The statistical analysis conducted on geographies consisting of 164,714,291 people shows a weak negative correlation between the proportion of Immigrants from Sweden and median female earnings in the United States with a correlation coefficient (R) of -0.280 and weighted average of $44,774. Similarly, the statistical analysis conducted on geographies consisting of 532,275,567 people shows no correlation between the proportion of Norwegians and median female earnings in the United States with a correlation coefficient (R) of 0.030 and weighted average of $38,802, a difference of 15.4%.
Median Female Earnings Correlation Summary
| Measurement | Immigrants from Sweden | Norwegian |
| Minimum | $6,800 | $19,310 |
| Maximum | $83,727 | $61,750 |
| Range | $76,927 | $42,440 |
| Mean | $46,568 | $37,022 |
| Median | $47,333 | $36,510 |
| Interquartile 25% (IQ1) | $35,642 | $33,325 |
| Interquartile 75% (IQ3) | $53,626 | $38,843 |
| Interquartile Range (IQR) | $17,985 | $5,519 |
| Standard Deviation (Sample) | $16,157 | $6,760 |
| Standard Deviation (Population) | $15,876 | $6,735 |
Similar Demographics by Median Female Earnings
Demographics Similar to Immigrants from Sweden by Median Female Earnings
In terms of median female earnings, the demographic groups most similar to Immigrants from Sweden are Immigrants from Belarus ($44,757, a difference of 0.040%), Immigrants from Korea ($44,847, a difference of 0.16%), Turkish ($44,695, a difference of 0.18%), Immigrants from Russia ($44,680, a difference of 0.21%), and Burmese ($44,911, a difference of 0.31%).
| Demographics | Rating | Rank | Median Female Earnings |
| Cypriots | 100.0 /100 | #18 | Exceptional $45,570 |
| Eastern Europeans | 100.0 /100 | #19 | Exceptional $45,385 |
| Immigrants | Japan | 100.0 /100 | #20 | Exceptional $45,323 |
| Cambodians | 100.0 /100 | #21 | Exceptional $45,014 |
| Immigrants | Greece | 100.0 /100 | #22 | Exceptional $44,976 |
| Burmese | 100.0 /100 | #23 | Exceptional $44,911 |
| Immigrants | Korea | 100.0 /100 | #24 | Exceptional $44,847 |
| Immigrants | Sweden | 100.0 /100 | #25 | Exceptional $44,774 |
| Immigrants | Belarus | 100.0 /100 | #26 | Exceptional $44,757 |
| Turks | 100.0 /100 | #27 | Exceptional $44,695 |
| Immigrants | Russia | 100.0 /100 | #28 | Exceptional $44,680 |
| Immigrants | Belgium | 100.0 /100 | #29 | Exceptional $44,587 |
| Asians | 100.0 /100 | #30 | Exceptional $44,586 |
| Immigrants | France | 100.0 /100 | #31 | Exceptional $44,541 |
| Immigrants | Northern Europe | 100.0 /100 | #32 | Exceptional $44,366 |
Demographics Similar to Norwegians by Median Female Earnings
In terms of median female earnings, the demographic groups most similar to Norwegians are Immigrants from Thailand ($38,810, a difference of 0.020%), Immigrants from Cambodia ($38,833, a difference of 0.080%), Czechoslovakian ($38,738, a difference of 0.17%), Aleut ($38,719, a difference of 0.21%), and Immigrants from Bosnia and Herzegovina ($38,886, a difference of 0.22%).
| Demographics | Rating | Rank | Median Female Earnings |
| Slovaks | 19.9 /100 | #202 | Poor $39,029 |
| Czechs | 18.7 /100 | #203 | Poor $38,992 |
| Immigrants | Uruguay | 17.3 /100 | #204 | Poor $38,945 |
| Immigrants | Colombia | 16.3 /100 | #205 | Poor $38,913 |
| Immigrants | Bosnia and Herzegovina | 15.6 /100 | #206 | Poor $38,886 |
| Immigrants | Cambodia | 14.2 /100 | #207 | Poor $38,833 |
| Immigrants | Thailand | 13.6 /100 | #208 | Poor $38,810 |
| Norwegians | 13.4 /100 | #209 | Poor $38,802 |
| Czechoslovakians | 12.0 /100 | #210 | Poor $38,738 |
| Aleuts | 11.6 /100 | #211 | Poor $38,719 |
| Guamanians/Chamorros | 11.5 /100 | #212 | Poor $38,717 |
| Jamaicans | 10.5 /100 | #213 | Poor $38,670 |
| Iraqis | 10.5 /100 | #214 | Poor $38,666 |
| Spaniards | 10.3 /100 | #215 | Poor $38,656 |
| Immigrants | Ecuador | 10.1 /100 | #216 | Poor $38,644 |