Black/African American vs Immigrants from Eastern Europe Median Female Earnings
COMPARE
Black/African American
Immigrants from Eastern Europe
Median Female Earnings
Median Female Earnings Comparison
Blacks/African Americans
Immigrants from Eastern Europe
$35,315
MEDIAN FEMALE EARNINGS
0.0/ 100
METRIC RATING
302nd/ 347
METRIC RANK
$43,309
MEDIAN FEMALE EARNINGS
99.9/ 100
METRIC RATING
53rd/ 347
METRIC RANK
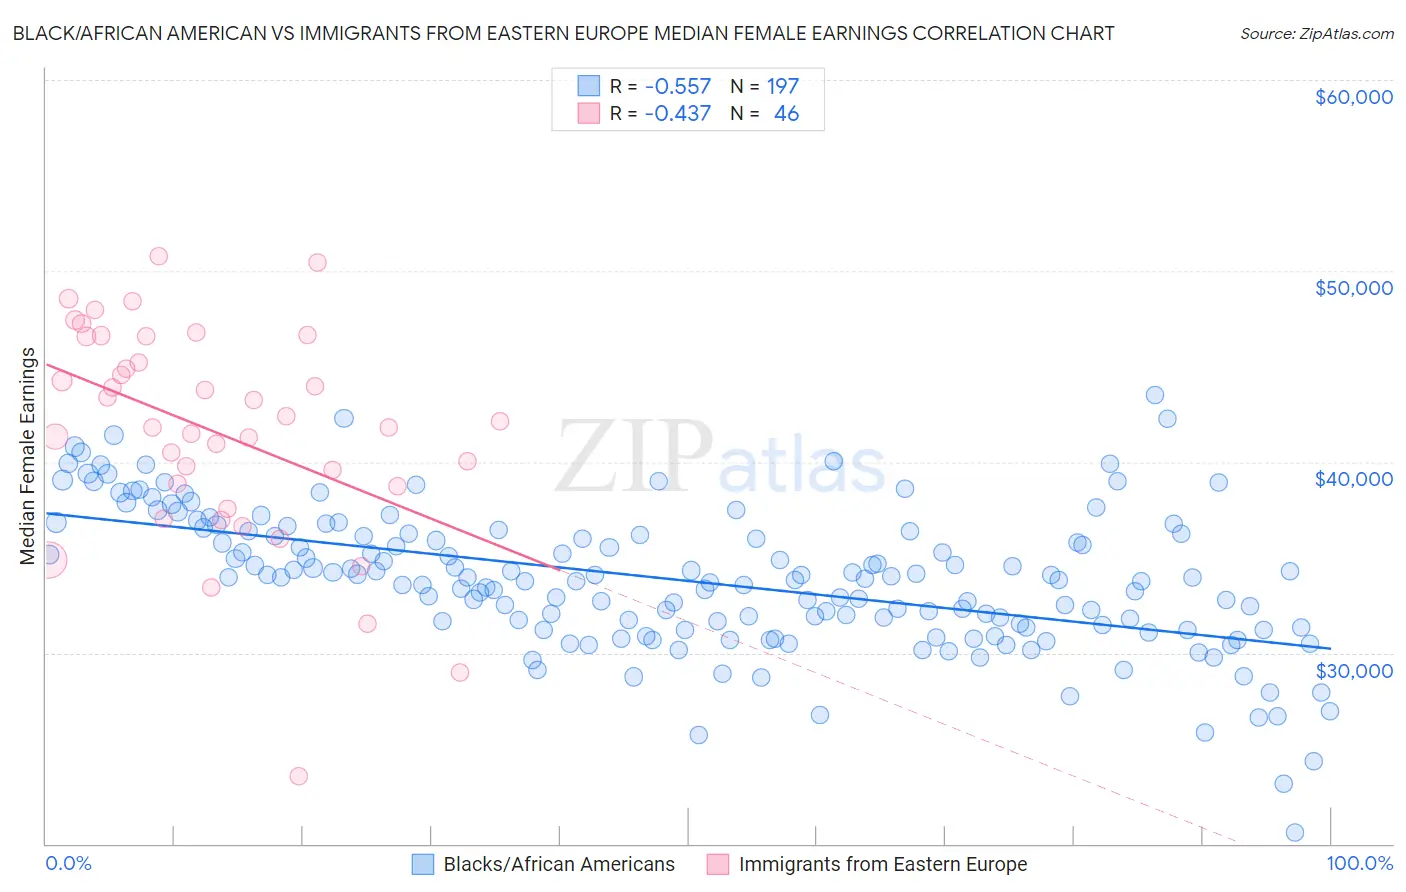
Black/African American vs Immigrants from Eastern Europe Median Female Earnings Correlation Chart
The statistical analysis conducted on geographies consisting of 562,880,101 people shows a substantial negative correlation between the proportion of Blacks/African Americans and median female earnings in the United States with a correlation coefficient (R) of -0.557 and weighted average of $35,315. Similarly, the statistical analysis conducted on geographies consisting of 475,519,051 people shows a moderate negative correlation between the proportion of Immigrants from Eastern Europe and median female earnings in the United States with a correlation coefficient (R) of -0.437 and weighted average of $43,309, a difference of 22.6%.
Median Female Earnings Correlation Summary
| Measurement | Black/African American | Immigrants from Eastern Europe |
| Minimum | $20,616 | $23,547 |
| Maximum | $43,481 | $50,763 |
| Range | $22,865 | $27,216 |
| Mean | $33,784 | $41,579 |
| Median | $33,890 | $41,989 |
| Interquartile 25% (IQ1) | $31,353 | $38,750 |
| Interquartile 75% (IQ3) | $36,250 | $46,583 |
| Interquartile Range (IQR) | $4,897 | $7,833 |
| Standard Deviation (Sample) | $3,688 | $5,669 |
| Standard Deviation (Population) | $3,678 | $5,607 |
Similar Demographics by Median Female Earnings
Demographics Similar to Blacks/African Americans by Median Female Earnings
In terms of median female earnings, the demographic groups most similar to Blacks/African Americans are Immigrants from Latin America ($35,307, a difference of 0.020%), Pima ($35,326, a difference of 0.030%), Crow ($35,266, a difference of 0.14%), Yuman ($35,377, a difference of 0.18%), and Immigrants from Guatemala ($35,444, a difference of 0.36%).
| Demographics | Rating | Rank | Median Female Earnings |
| Comanche | 0.0 /100 | #295 | Tragic $35,661 |
| Mexican American Indians | 0.0 /100 | #296 | Tragic $35,629 |
| Hmong | 0.0 /100 | #297 | Tragic $35,498 |
| Immigrants | Micronesia | 0.0 /100 | #298 | Tragic $35,477 |
| Immigrants | Guatemala | 0.0 /100 | #299 | Tragic $35,444 |
| Yuman | 0.0 /100 | #300 | Tragic $35,377 |
| Pima | 0.0 /100 | #301 | Tragic $35,326 |
| Blacks/African Americans | 0.0 /100 | #302 | Tragic $35,315 |
| Immigrants | Latin America | 0.0 /100 | #303 | Tragic $35,307 |
| Crow | 0.0 /100 | #304 | Tragic $35,266 |
| Bahamians | 0.0 /100 | #305 | Tragic $35,125 |
| Fijians | 0.0 /100 | #306 | Tragic $35,114 |
| Sioux | 0.0 /100 | #307 | Tragic $35,063 |
| Immigrants | Bahamas | 0.0 /100 | #308 | Tragic $35,027 |
| Hondurans | 0.0 /100 | #309 | Tragic $35,013 |
Demographics Similar to Immigrants from Eastern Europe by Median Female Earnings
In terms of median female earnings, the demographic groups most similar to Immigrants from Eastern Europe are Australian ($43,308, a difference of 0.0%), Egyptian ($43,305, a difference of 0.010%), Immigrants from Lithuania ($43,317, a difference of 0.020%), Maltese ($43,357, a difference of 0.11%), and Immigrants from Uzbekistan ($43,363, a difference of 0.12%).
| Demographics | Rating | Rank | Median Female Earnings |
| Immigrants | Bolivia | 100.0 /100 | #46 | Exceptional $43,467 |
| Bolivians | 100.0 /100 | #47 | Exceptional $43,445 |
| Immigrants | Indonesia | 100.0 /100 | #48 | Exceptional $43,412 |
| Immigrants | Serbia | 100.0 /100 | #49 | Exceptional $43,385 |
| Immigrants | Uzbekistan | 100.0 /100 | #50 | Exceptional $43,363 |
| Maltese | 100.0 /100 | #51 | Exceptional $43,357 |
| Immigrants | Lithuania | 99.9 /100 | #52 | Exceptional $43,317 |
| Immigrants | Eastern Europe | 99.9 /100 | #53 | Exceptional $43,309 |
| Australians | 99.9 /100 | #54 | Exceptional $43,308 |
| Egyptians | 99.9 /100 | #55 | Exceptional $43,305 |
| Immigrants | Croatia | 99.9 /100 | #56 | Exceptional $43,258 |
| Ethiopians | 99.9 /100 | #57 | Exceptional $43,243 |
| Paraguayans | 99.9 /100 | #58 | Exceptional $43,173 |
| Estonians | 99.9 /100 | #59 | Exceptional $43,106 |
| Immigrants | Latvia | 99.9 /100 | #60 | Exceptional $43,099 |