Immigrants from Caribbean vs Immigrants from Eastern Europe Median Female Earnings
COMPARE
Immigrants from Caribbean
Immigrants from Eastern Europe
Median Female Earnings
Median Female Earnings Comparison
Immigrants from Caribbean
Immigrants from Eastern Europe
$36,414
MEDIAN FEMALE EARNINGS
0.1/ 100
METRIC RATING
279th/ 347
METRIC RANK
$43,309
MEDIAN FEMALE EARNINGS
99.9/ 100
METRIC RATING
53rd/ 347
METRIC RANK
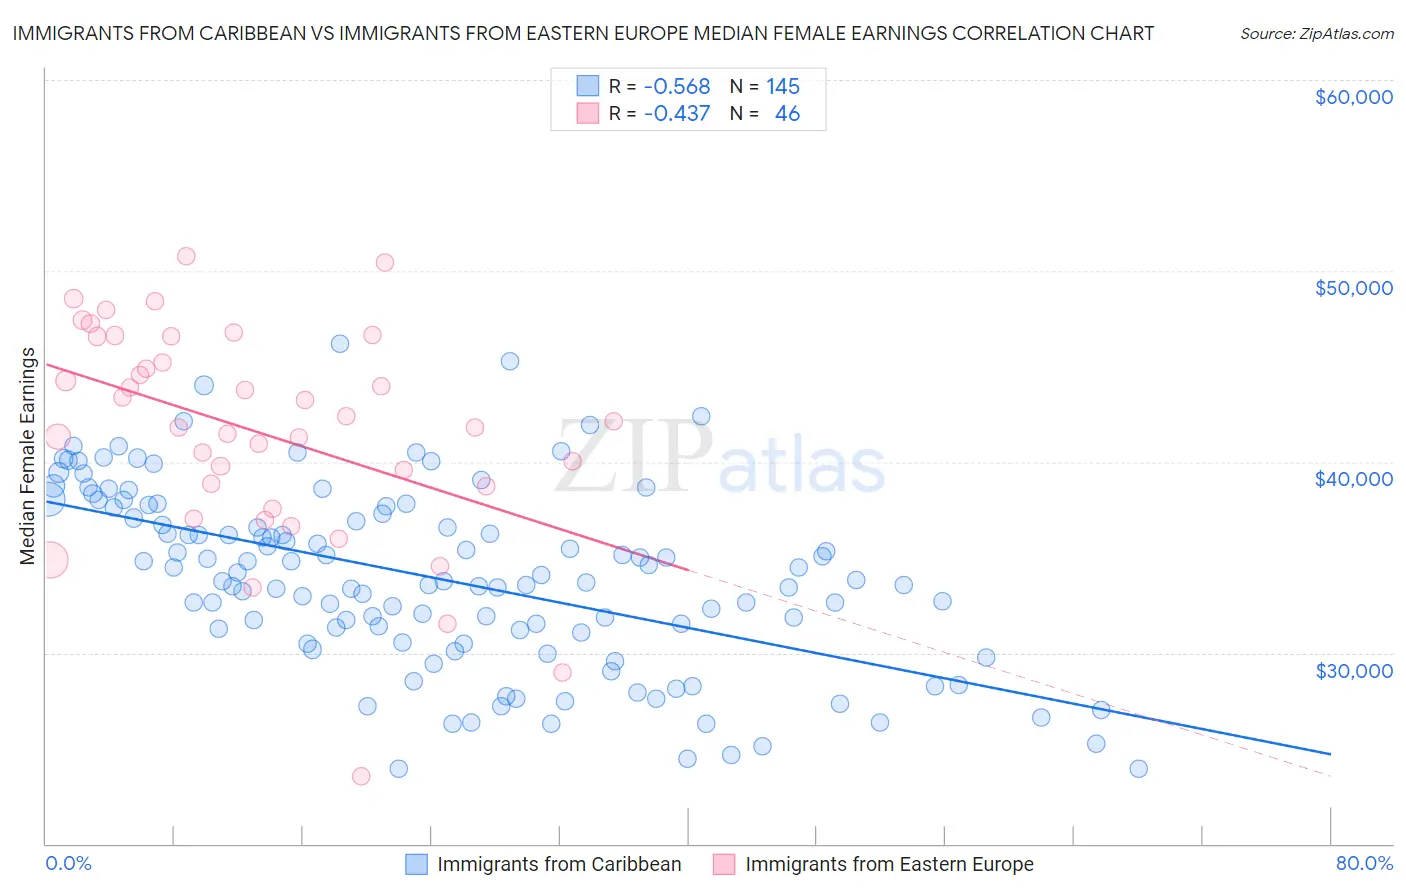
Immigrants from Caribbean vs Immigrants from Eastern Europe Median Female Earnings Correlation Chart
The statistical analysis conducted on geographies consisting of 449,719,186 people shows a substantial negative correlation between the proportion of Immigrants from Caribbean and median female earnings in the United States with a correlation coefficient (R) of -0.568 and weighted average of $36,414. Similarly, the statistical analysis conducted on geographies consisting of 475,519,051 people shows a moderate negative correlation between the proportion of Immigrants from Eastern Europe and median female earnings in the United States with a correlation coefficient (R) of -0.437 and weighted average of $43,309, a difference of 18.9%.
Median Female Earnings Correlation Summary
| Measurement | Immigrants from Caribbean | Immigrants from Eastern Europe |
| Minimum | $23,937 | $23,547 |
| Maximum | $46,205 | $50,763 |
| Range | $22,268 | $27,216 |
| Mean | $33,887 | $41,579 |
| Median | $33,768 | $41,989 |
| Interquartile 25% (IQ1) | $30,791 | $38,750 |
| Interquartile 75% (IQ3) | $37,444 | $46,583 |
| Interquartile Range (IQR) | $6,654 | $7,833 |
| Standard Deviation (Sample) | $4,730 | $5,669 |
| Standard Deviation (Population) | $4,714 | $5,607 |
Similar Demographics by Median Female Earnings
Demographics Similar to Immigrants from Caribbean by Median Female Earnings
In terms of median female earnings, the demographic groups most similar to Immigrants from Caribbean are Iroquois ($36,408, a difference of 0.020%), U.S. Virgin Islander ($36,424, a difference of 0.030%), Spanish American ($36,391, a difference of 0.060%), Haitian ($36,374, a difference of 0.11%), and Marshallese ($36,459, a difference of 0.12%).
| Demographics | Rating | Rank | Median Female Earnings |
| Immigrants | Dominican Republic | 0.3 /100 | #272 | Tragic $36,857 |
| Immigrants | Laos | 0.3 /100 | #273 | Tragic $36,841 |
| Immigrants | El Salvador | 0.2 /100 | #274 | Tragic $36,673 |
| Africans | 0.1 /100 | #275 | Tragic $36,530 |
| Central Americans | 0.1 /100 | #276 | Tragic $36,492 |
| Marshallese | 0.1 /100 | #277 | Tragic $36,459 |
| U.S. Virgin Islanders | 0.1 /100 | #278 | Tragic $36,424 |
| Immigrants | Caribbean | 0.1 /100 | #279 | Tragic $36,414 |
| Iroquois | 0.1 /100 | #280 | Tragic $36,408 |
| Spanish Americans | 0.1 /100 | #281 | Tragic $36,391 |
| Haitians | 0.1 /100 | #282 | Tragic $36,374 |
| Immigrants | Haiti | 0.1 /100 | #283 | Tragic $36,203 |
| Indonesians | 0.1 /100 | #284 | Tragic $36,140 |
| Paiute | 0.1 /100 | #285 | Tragic $36,056 |
| Osage | 0.0 /100 | #286 | Tragic $36,034 |
Demographics Similar to Immigrants from Eastern Europe by Median Female Earnings
In terms of median female earnings, the demographic groups most similar to Immigrants from Eastern Europe are Australian ($43,308, a difference of 0.0%), Egyptian ($43,305, a difference of 0.010%), Immigrants from Lithuania ($43,317, a difference of 0.020%), Maltese ($43,357, a difference of 0.11%), and Immigrants from Uzbekistan ($43,363, a difference of 0.12%).
| Demographics | Rating | Rank | Median Female Earnings |
| Immigrants | Bolivia | 100.0 /100 | #46 | Exceptional $43,467 |
| Bolivians | 100.0 /100 | #47 | Exceptional $43,445 |
| Immigrants | Indonesia | 100.0 /100 | #48 | Exceptional $43,412 |
| Immigrants | Serbia | 100.0 /100 | #49 | Exceptional $43,385 |
| Immigrants | Uzbekistan | 100.0 /100 | #50 | Exceptional $43,363 |
| Maltese | 100.0 /100 | #51 | Exceptional $43,357 |
| Immigrants | Lithuania | 99.9 /100 | #52 | Exceptional $43,317 |
| Immigrants | Eastern Europe | 99.9 /100 | #53 | Exceptional $43,309 |
| Australians | 99.9 /100 | #54 | Exceptional $43,308 |
| Egyptians | 99.9 /100 | #55 | Exceptional $43,305 |
| Immigrants | Croatia | 99.9 /100 | #56 | Exceptional $43,258 |
| Ethiopians | 99.9 /100 | #57 | Exceptional $43,243 |
| Paraguayans | 99.9 /100 | #58 | Exceptional $43,173 |
| Estonians | 99.9 /100 | #59 | Exceptional $43,106 |
| Immigrants | Latvia | 99.9 /100 | #60 | Exceptional $43,099 |